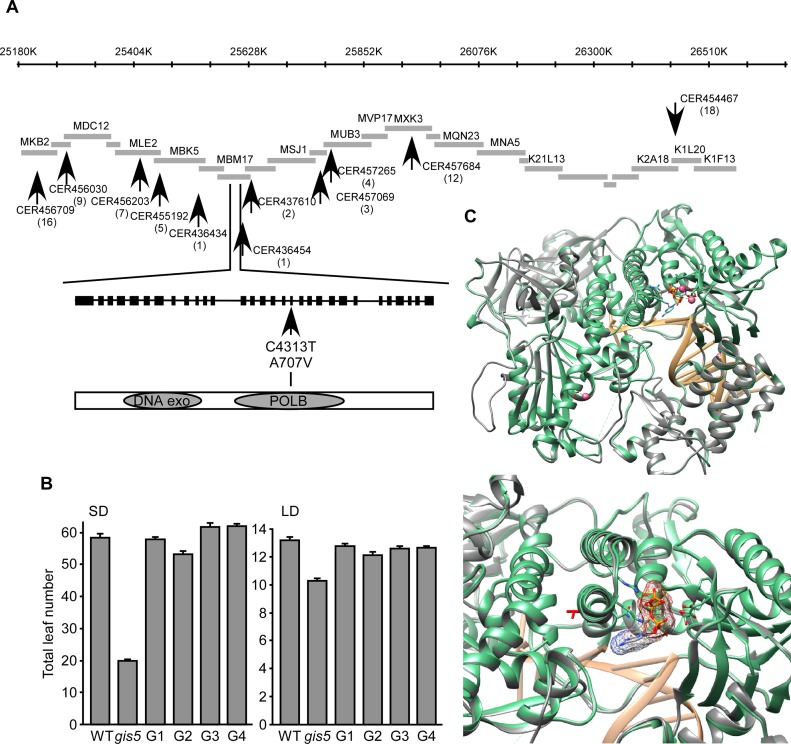
Fig 2. gis5 affects the catalytic subunit of Polδ.
(A) Positional cloning of gis5. Representation of a chromosome V interval, overlapping BACs and markers (arrows) used to screen for recombinants. The gis5 interval is flanked by markers CER436434 and CER436454. A C>T transition was detected in the 18th exon of the At5g63960 locus (POLD1) leading to an Ala to Val substitution in the catalytic subunit of Polδ. (B) The WT POLD1 sequence complements gis5 flowering phenotype. Four independent gis5 transgenic lines (G1 to G4), bearing a WT fragment of POLD1, were grown under SD (left panel) or LD (right panel) conditions. Bars represent the mean ± SEM of at least 12 plants for each genotype. (C) Superposition of the structural model of the catalytic subunit of Polδ and the yeast pol3 (pdb code: 3IAY). The program “Modeller” Version 9.13 [62] was used to construct the model using the X-ray structure of pol3 [27] (Top panel). Ribbon representation of the yeast Pol3, the Arabidopsis Polδ model and the DNA colored in green, gray and light orange respectively. Shown as sticks: ligand 2'-DEOXYCYTIDINE-5'-TRIPHOSPHATE (orange), 3IAY residues contacting the ligand (green). Shown as pink spheres are the Ca ions. Bottom panel: A detailed view of the modeled Polδ V707 (red sticks), which shows that the lateral chain points in the opposite direction of the substrate binding pocket.

