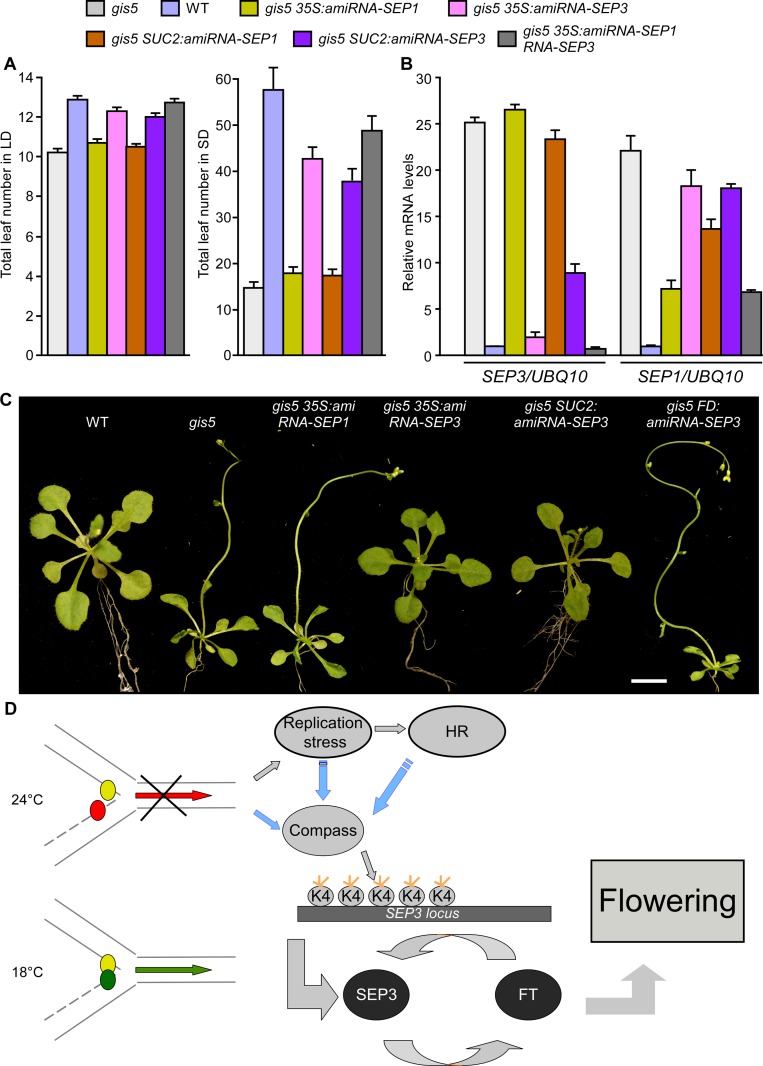
Fig 7. High levels of SEP3 expression are required for gis5 early flowering and leaf phenotype.
(A) SEP3 downregulation delays flowering in gis5 mutants. Plants of the genotypes indicated in coloured bars were grown under either LD (left panel) or SD (right panel) at 23°C. The total leaf number (cauline and rosette leaves) was recorded at the time of flowering. Bars represent the mean ± SEM of at least 12 plants for each genotype. (B) SEP3 and SEP1 mRNA expression levels were determined in the same genotypes shown in (A) as described in Fig. 5. Bars represent the mean ± SEM of 3 independent biological replicates, each replicate analyzed in triplicate. (C) SEP3 downregulation suppresses gis5 curly leaf phenotype. Plants of the indicated genotypes were grown under LD at 23°C and photographed at flowering stages. Scale bar: 1 cm. (D) A model explaining the temperature-dependent effect of the gis5 allele. The replication fork is represented and works normally at 18°C (green arrow) but is stalled at 24°C (red arrow). Small colored circles represent Polε (leading strand) and Polδ (lagging strand). At higher temperatures Polδ is delayed (red circle), triggering a DNA replication stress response and increased H3K4me3 at the SEP3 locus which participates in a positive feedback loop with FT to induce flowering and the curly leaf phenotype. Blue arrows indicate tentative relationships, not tested yet. The Compass complex was tentatively included because of its role in H3K4me3 establishment. Orange short lines represent trimethylation in H3K4.

