Figure 4.

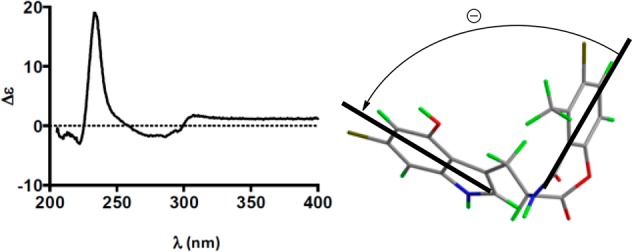
Experimental CD spectra and stereoview of 3 displaying the negative helicity between chromophores. Bold lines denote the electric dipole of the chromophores.

Experimental CD spectra and stereoview of 3 displaying the negative helicity between chromophores. Bold lines denote the electric dipole of the chromophores.