
Figure 3.
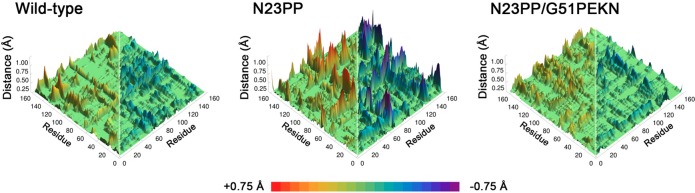
Conformational changes measured by thermally averaged Cα–Cα distance changes from the reactant state to the transition state of the hydride transfer reaction observed in EVB-MD simulations of WT ecDHFR, N23PP ecDHFR, and N23PP/G51PEKN ecDHFR.27 For clarity, only distances that increase are shown on the left side of each plot, while only distances that decrease are shown on the right.