
Figure 5.
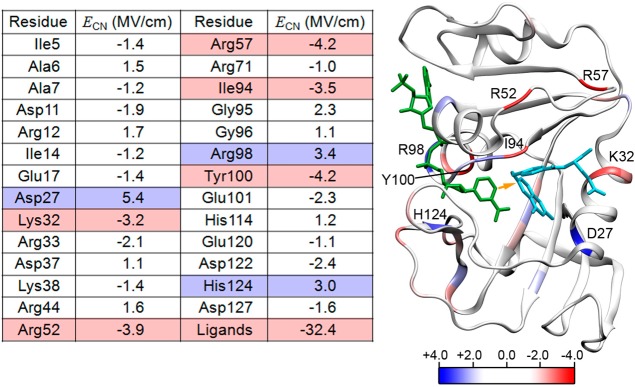
Ribbon structure of ecDHFR colored according to residue-based contributions to the calculated electric field along the hydride transfer D–A axis (depicted as an orange arrow) for selected residues from MD simulations of the model Michaelis complex E:FOL:NADP+. Positive values of the electric field disfavor hydride transfer, while negative values facilitate hydride transfer. NADP+ is colored green, and folate is colored sky blue.