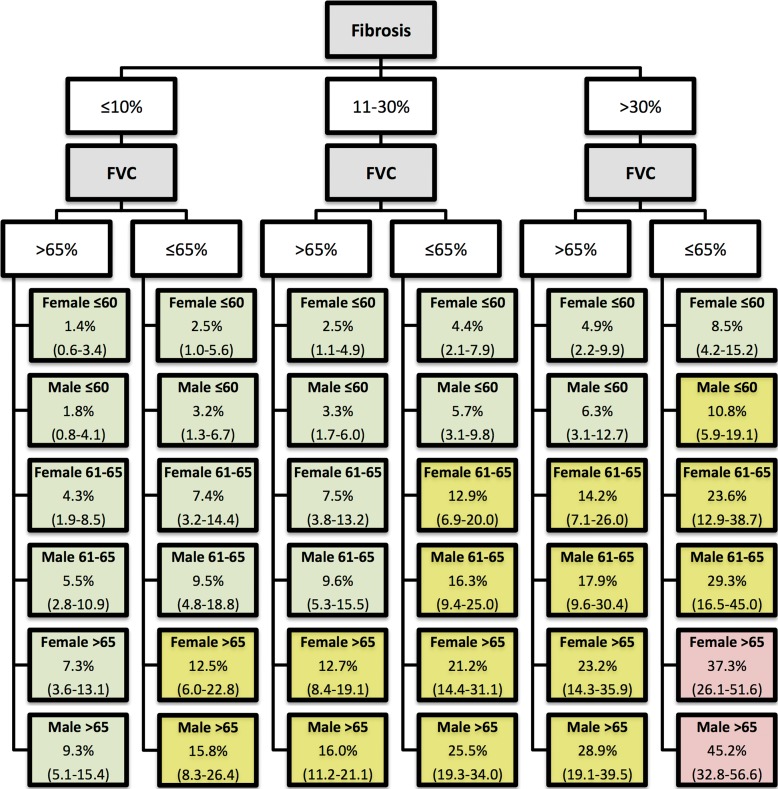
Figure 3:
Illustration shows the categorical CT-GAP model in simple algorithm form. Lowest tier boxes show 1-year model-estimated risk of death in percentages, with 95% CIs in parentheses according to gender and age (eg, female 61–65). Pale green boxes correspond to low 1-year risk (<10%); yellow boxes correspond to intermediate 1-year risk (10%–30%); and red boxes correspond to high 1-year risk (>30%). Fibrosis = percentage of fibrosis at CT; FVC = forced vital capacity compared with percentage predicted.

