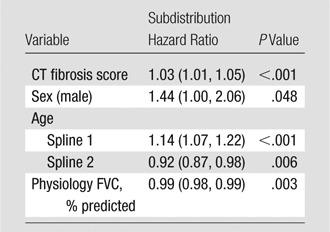
Table 3.
Continuous CT-GAP Model: Multivariate Analysis for Risk of Death

Note.—Data in parentheses are 95% CIs. Analysis was of the combined cohort. Model discrimination: C index for cohort 1, 67.6 (95% CI: 59.9, 73.2); cohort 2, 66.0 (95% CI: 59.1, 71.4); combined, 69.2 (95% CI: 65.2, 72.9).
