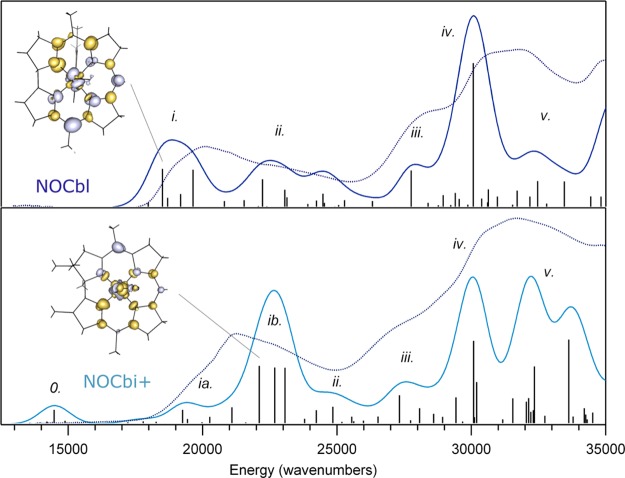
Figure 6.
Abs spectra of NOCbl (top) and NOCbi+ (bottom) collected at 4.5 K (dotted lines) superimposed on the TD-DFT results. The TD-DFT computed transitions (vertical sticks) were convoluted with Gaussian bands with a constant fwhm of 1250 cm–1 to obtain the predicted spectra plotted in dark blue for NOCbl and in light blue for NOCbi+. In each case, the EDDM for the α-band transition is shown on the left, where regions of loss and gain of electron density are shown in gray and gold, respectively. The calculated spectra were uniformly red-shifted by 2200 cm–1 to facilitate a direct comparison with the experimental results.

