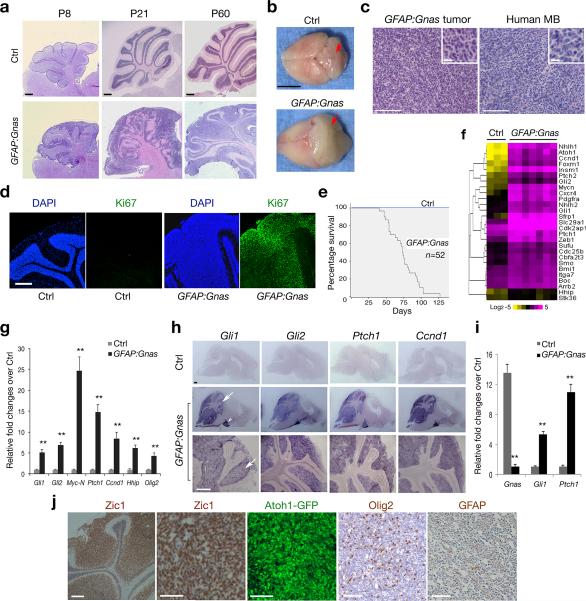
Figure 2. Loss of Gnas in neural stem/progenitor cells induces MB formation.
(a) Sagittal brain sections from hGFAPCre:Gnaslox/lox (GFAP:Gnas) and hGFAPCre:Gnaslox/+ (Ctrl) mice at indicated stages were stained with hematoxylin and eosin (H/E).
(b) Brain appearance of control and Gnas mutants at P67. The arrows indicate the cerebellum.
(c) Tumors from Gnas mutants (left) displays similar histology to human MB (right; SHH group). Insets are shown at high magnification.
(d) The cerebella of control and Gnas mutants at P60 were stained with anti-Ki67 and DAPI.
(e) Kaplan-Meier survival curves for control and GFAP:Gnas mice (n = 52).
(f) Heatmap shows expression of Shh pathway components in control cerebella and GFAP:Gnas tumor tissues. The color bar shows expression intensity.
(g) qRT-PCR quantification of Gnas and Shh pathway genes in control and GFAP:Gnas cerebella at P30. Data represent the mean ± SEM (n = six animals). ** P < 0.01; Student's t test.
(h) mRNA expression of Shh target genes as indicated in control and GFAP:Gnas brain sections at P60. Arrow and arrowhead indicate the cerebellum and pontine grey nucleus, respectively.
(i) qRT-PCR analysis of Gnas, Gli1 and Ptch1 in GNPs from control and GFAP:Gnas mice at P7. Data represent the mean ± SEM (n = five animals). ** P < 0.01; Student's t test.
(j) The cerebellar EGL region of GFAP:Gnas mice carrying the Atoh1-GFP reporter at P50 was immunostained with anti-Zic1, Olig2 and GFAP as indicated.
Scale bars in a, 300 μm; b, 5 mm; c, d, h, 200 μm; inset in c, 10 μm; j, 100 μm.

