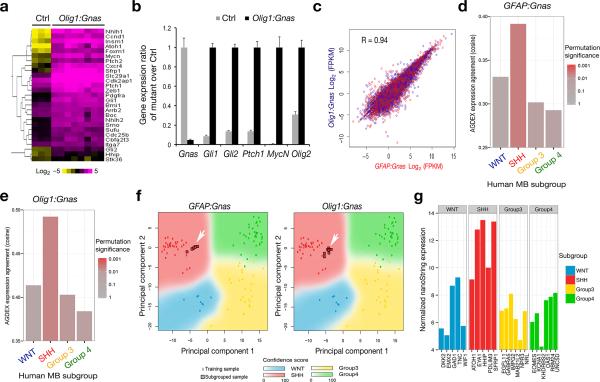
Figure 6. Tumors in Gnas mutants exhibit a gene expression signature resembling SHH-MB.
(a) Heatmap analysis of gene profiling of control cerebella (n = 3) and tumor tissues (n = 8) from Olig1:Gnas mutants by RNA-sequencing shows upregulation of Shh pathway components in tumors. The color bar shows expression intensity.
(b) Relative expression of Shh pathway components between control and Olig1:Gnas tumors from four month old animals (n = eight per group) was assayed by qRT-PCR. ** p < 0.01; Student's t test.
(c) Regression analysis of gene expression profiles indicates a direct correlation of gene transcription profiles between GFAP:Gnas and Olig1:Gnas tumors (n = eight per group).
(d-e) Cross-species comparison of global differential expression from Affymetrix microarray analysis of mouse tumors (n = eight per group) with bona fide human MB subgroups by AGDEX3 R algorithm. Bar graphs represent the cosine similarity measure and reflect the similarity of global expression profile between each mouse tumor subtype and each human MB subgroup.
(f) Principal component analysis (PCA) of expression profiles between human and above mouse tumor samples. Arrows indicate that gene expression profiles of mouse tumors match to Shh-subgroup.
(g) Subgrouping analysis by nanoString technology indicates the MB from the patient with a GNAS homozygous nonsense mutation resembles a SHH-group tumor with high confidence (PAM prediction score = 0.999996).

