Figure 1.
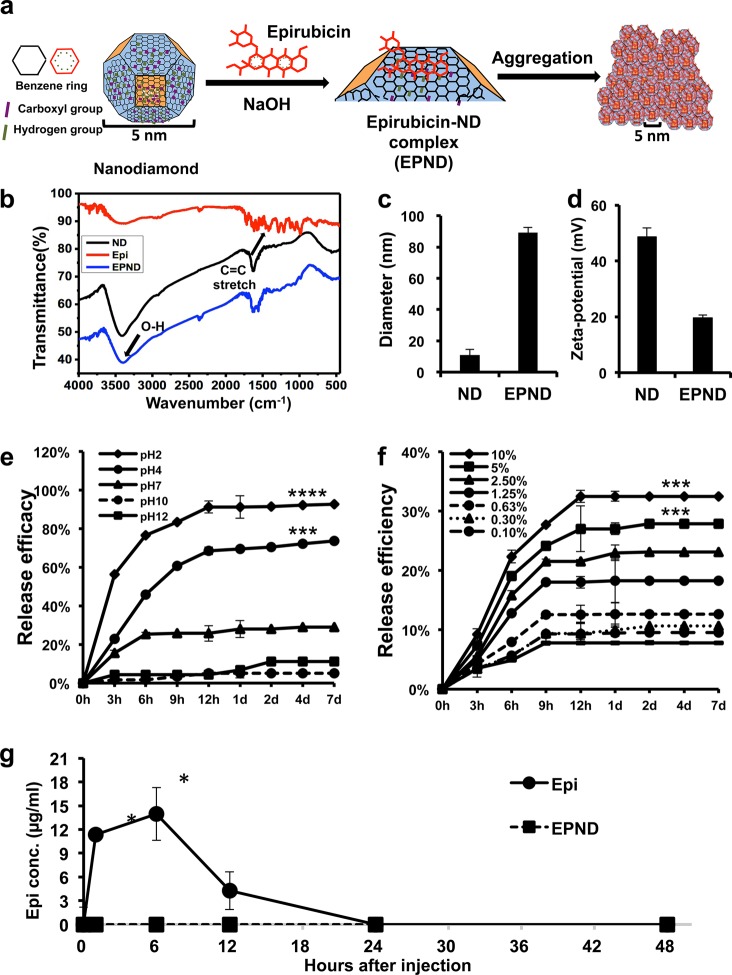
Characterization of nanodiamond, Epirubicin, EPND complex and release profile of Epirubicin. (a) Schematic model showing surface and chemical structure of nanodiamond (ND) and Epirubicin (Epi), synthesis and aggregation of EPND. ND represented in truncated octahedron structure with different surface charge denoted with color. ND surface functional group indicated, including benzene ring, carboxyl group and hydrogen group. Molecular skeleton representing carbon, oxygen and nitrogen atoms in Epi molecule was shown in red. Synthesis of EPND was performed under basic condition of 2.5 mM NaOH through physical adsorption between Epi and ND. Aggregation around 90 nm was formed after EPND synthesis. (b) FTIR spectra of ND (black line), Epi (red line), and EPND (blue line) indicating surface functional groups. Black arrows indicating surface functional groups of O–H stretch signals between 3300 and 3500 cm–1 and C=C stretch signals between 1400 and 1600 cm–1 presenting aromatic rings of anthracyclines. (c) Size distribution of ND (10.9 ± 3.6 nm) and EPND (89.2 ± 3.3 nm) after Epirubicin loading analyzed via dynamic light scattering (DLS) analysis. Data are represented as mean ± SD. (d) Zeta-potential of ND (48.6 ± 3.3) and EPND (19.6 ± 1.1) indicating surface charge. Data are represented as mean ± SD; ***, p < 0.001; ****, p < 0.0001. (e) Release profile of Epi from EPND under various pH conditions. Epi elution was evaluated over a period of 7 d under pH 2, 4, 7, 10, and 12 conditions. Data are represented as mean ± SD. (f) Release profile of Epi from EPND under different FBS concentrations over a period of 7 d. Epi elution was the most in 10% FBS. Data are represented as mean ± SD; ***, p < 0.001. (g) Free Epi concentration in mice serum following Epi or EPND injection. Data are represented as mean ± SD; *, p < 0.05.

