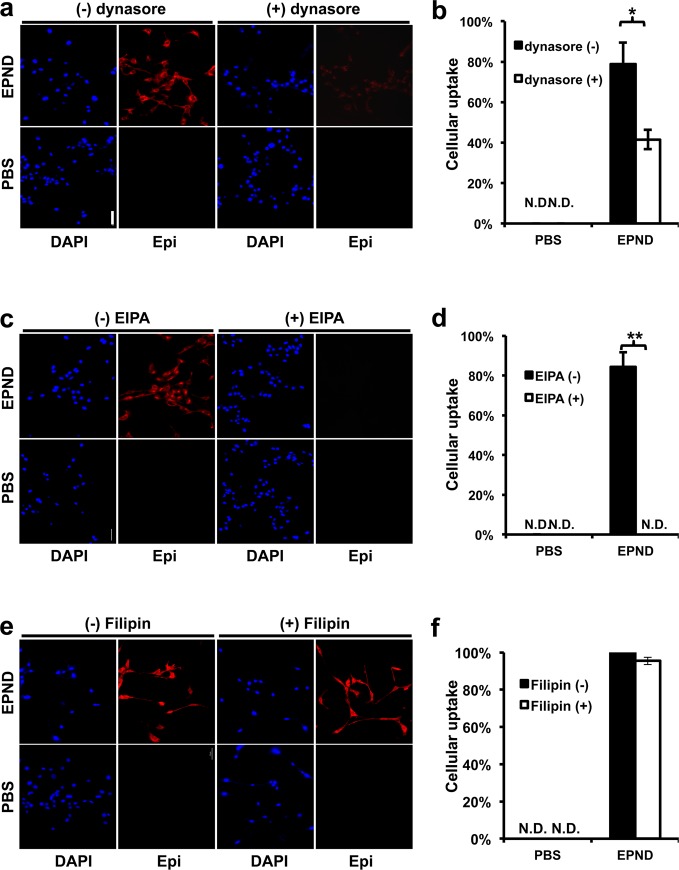
Figure 2.
EPND uptake is mediated by multiple endocytic pathways. (a) Representative images of cellular EPND uptake after dynasore treatment by fluorescent microscopy. LT2-MYC cells treated with or without dynasore (100 μM) for 30 min followed by 30 min treatment with 35 μM EPND (upper panels) or PBS control (bottom panels). Blue and red fluorescent signals represent diamidino-2-phenylindole (DAPI) staining and Epirubicin (Epi) respectively. Scale bar (white), 50 μm. (b) Quantification of percent cellular EPND uptake normalized to DAPI signal (n = 3 per treatment condition). Data are represented as mean ± SD; *, p < 0.05. N.D. denotes nondetectable signal. (c) Representative images of cellular EPND uptake after 5-(N-ethyl-N-isopropyl) amiloride (EIPA) treatment by fluorescent microscopy. LT2-MYC cells treated with or without EIPA (50 μM) for 30 min following by 30 min treatment with 35 μM EPND (upper panels) or PBS control (bottom panels). Blue and red fluorescent signals represent DAPI staining and Epi, respectively. Scale bar (white), 50 μm. (d) Quantification of percent cellular EPND uptake normalized to DAPI signal (n = 3 per treatment condition). Data are represented as mean ± SD; **, p < 0.01. N.D. denotes nondetectable signal. (e) Representative images of cellular EPND uptake after Filipin treatment by fluorescent microscopy. LT2-MYC cells treated with or without Filipin (50 μg/mL) for 30 min followed by 30 min treatment with 35 μM EPND (upper panels) or PBS control (bottom panel). Blue and red fluorescent signals represent DAPI staining and Epi, respectively. Scale bar (white), 50 μm. (f) Quantification of percent cellular EPND uptake normalized to DAPI signal (n = 3 per treatment condition). Data are represented as mean ± SD. N.D. denotes nondetectable signal.

