
Figure 3.
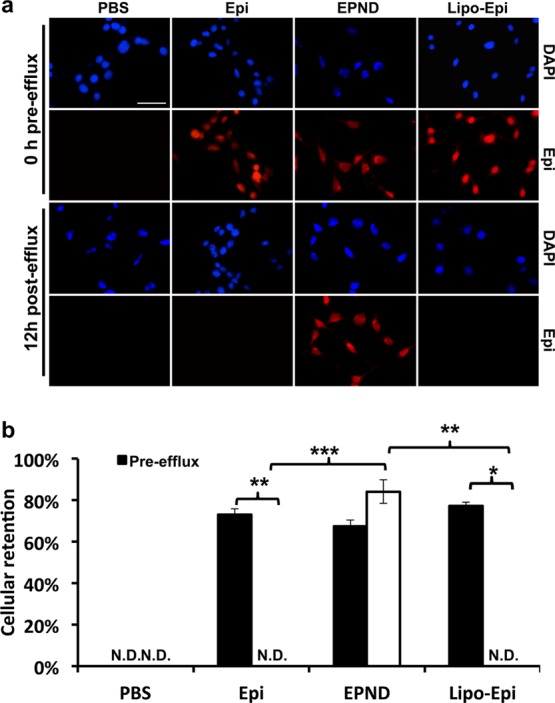
Cellular drug retention in hepatic tumor cell line of EPND and Epirubicin. (a) Representative images of cellular drug retention in LT2-MYC cells by fluorescent microscopy. LT2-MYC cells treated with Epirubicin (Epi) (35 μM), EPND (35 μM) or Liposomal–Epirubicin (Lipo-Epi) (35 μM) for 1 h before 12 h efflux. Blue and red fluorescent signals represent diamidino-2-phenylindole (DAPI) staining and Epirubicin, respectively. Scale bar (white), 50 μm. (b) Cellular retention is quantified by percent of drug retention normalized to DAPI signal (n = 3). Data are represented as mean ± SD; *, p < 0.05; **, p < 0.01; ***, p < 0.001. N.D. denotes nondetectable signal.