
Figure 4.
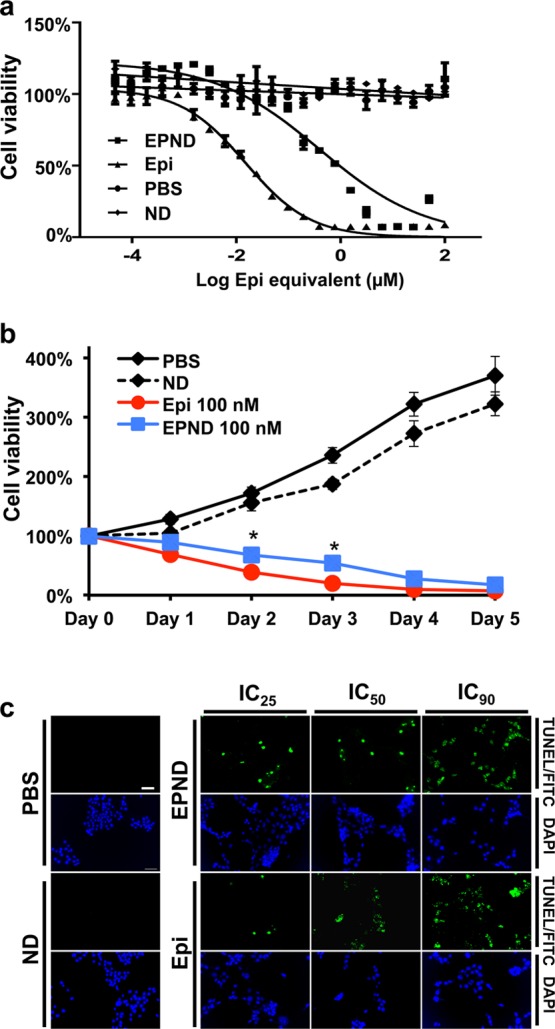
Evaluation of EPND efficacy in vitro. (a) Dose response curves of LT2-MYC cells after exposure to PBS, nanodiamond (ND) and a range of Epirubicin (Epi) and EPND concentrations. IC50 of Epi =16 nM, IC50 of EPND = 450 nM. Data are represented as mean ± SD. (b) Live cell number counting during 5 days of PBS, ND, Epi (100 nM) and EPND (100 nM) treatment. Data are represented as mean ± SD, *, p < 0.05. (c) TUNEL analysis of LT2-MYC cells after Epi and EPND treatment at IC25, IC50, and IC90 concentrations respectively with ND and PBS as control. Green and blue fluorescent signals representing apoptosis by fluorescein isothiocyanate (FITC)/TUNEL staining and diamidino-2-phenylindole (DAPI) staining, respectively. Scale bar (white), 50 μm.