Figure 1.
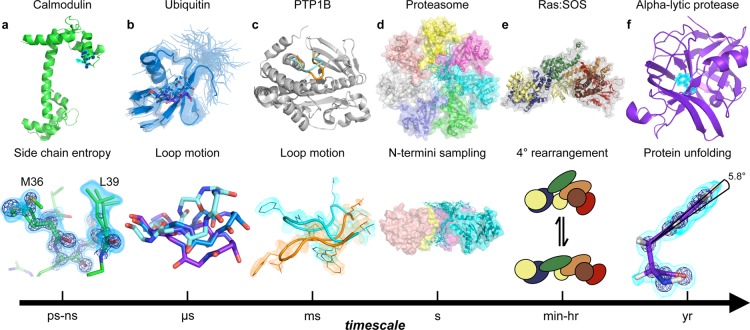
Protein dynamics occur at different time scales. (a) Motions on the picosecond to nanosecond scale involve small changes in backbone or side chain torsion angles.60 Calcium bound calmodulin (1exr, upper) exhibits conformational heterogeneity on the interface of the peptide binding site. The residual conformational entropy of binding61,62 depends on side chains sampling alternative conformations as exemplified by Met36 and Leu39 (lower). Electron density contoured to 2.5 e–/Å3 in a dark blue mesh and 0.8 e–/Å3 in cyan volume representation. The lessons from calmodulin likely apply to enzymes where the loss of conformational entropy associated with the rigidification of active-site loops or side chains can specifically weaken binding to substrate or product complexes63 and promote flux through the catalytic cycle. (b) A model of ubiquitin (2k39) derived from RDC data reporting on motions up to microseconds is shown as cartoon, with the other models in the ensemble shown as transparent ribbons (upper). The dynamic β1β2 loop moves between alternative loop conformations, represented as sticks (upper and lower). The population of the up (cyan), mid (blue), and down (purple) β1β2 conformations can be a critical determinant of binding preferences for protein–protein interactions.64 The rates of transition between these states discriminate between induced fit and conformational selection mechanisms,65,66 which can influence catalytic mechanisms and inhibitor discovery.67 (c) For enzymes, loop motions on the millisecond time scale are often rate limiting for catalytic cycles, with essential roles for governing ligand flux68 and repositioning key catalytic residues for catalysis.69 The WPD loop of protein tyrosine phosphatase 1B (PTP1B) moves between the “closed” (1sug, orange) and “open” (1t49, cyan) form on the millisecond time scale, forming the catalytically competent closed active site conformation.69 Further molecular detail of the two conformations are shown in the lower panel with electron density contoured to 0.3 e–/Å3. (d) The archaeal proteasome, a ∼700-kDa complex, controls active site access through the dynamic exchange of the N-terminus to block or reveal the central pore on the time scale of seconds.70 The structure of the proteasome is shown as a homoheptamer with each subunit in a different color (upper). In the lower panel, the ensemble of structures of the N-terminus of one of the seven subunits is shown in blue (2ku1). (e) Many enzymes enter long-lived states, with distinct catalytic activities, through stochastic fluctuations.71 Quaternary structure reconstruction of two RAS molecules (yellow) and son of sevenless (SOS, gray surface) complex. The Cdc25, REM, DH, histone, and PH domains of SOS are colored blue, green, orange, brown, and red, respectively (1xd2 (RAS) and 3ksy (SOS)). This complex exchanges between long-lived states with distinct catalytic rates. The structural basis of this exchange is currently unknown but likely involves rearrangements of protein–protein interfaces shown schematically in equilibrium.72 (f) The folded crystal structure (1ssx) of α-lytic protease (upper) is a kinetically trapped structure. After folding catalyzed by a proline domain, the kinetic barrier to unfolding makes this protein stable on the scale of years. The benzoyl moiety of Phe228 deviates by 6° from planarity. Removing this distortion can change the unfolding barrier from over a year to less than 2 weeks.73 Electron density contoured to 4.75 e–/Å3 (dark blue mesh, lower) and 0.5 e–/Å3 (cyan volume representation).

