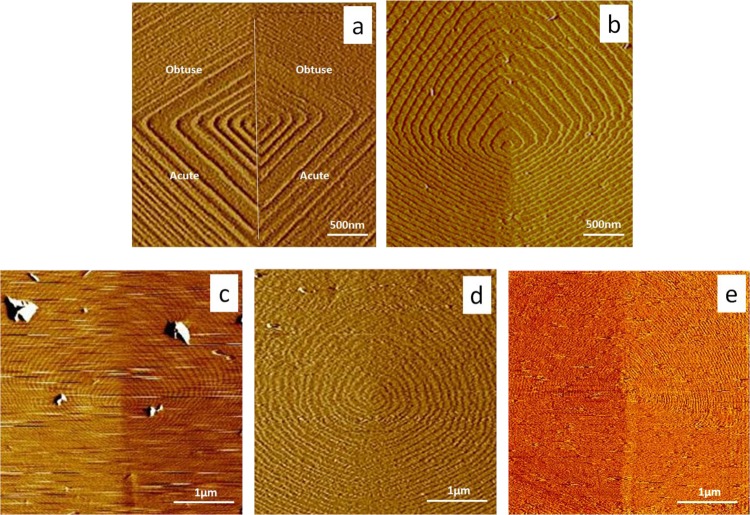
Figure 1.
AFM images of calcite growth spirals in (a, b) protein-free solutions at σ = 2.3 for (a) pH = 8.4 and (b) pH = 7.4; (c) 50 nM fetuin at pH = 7.4, (d) 80 nM OPN at pH = 7.4 and (e) 40 nM OC90 at pH = 7.4. All images were captured with obtuse steps up and acute sites at the bottom, as marked in (a). Panels (a) and (b) demonstrate the effect of pH on hillock morphology. Steps are partially covered or pinned by fetuin A, OPN, or OC90 in panels (c–e) respectively and the step velocity drops to about 50% of the original value. Image sizes are (a) and (b) 3 × 3 μm; (c) to (e) 4 × 4 μm. (Note that the differences in step spacing seen in (c–e) reflect the differences in step speed obtained with each protein.)

