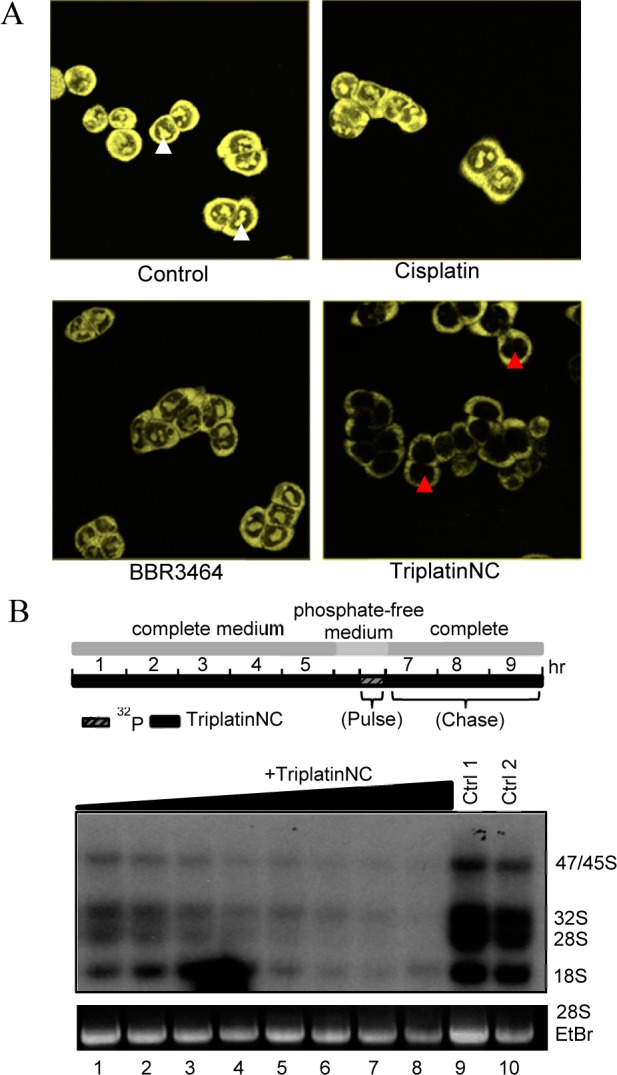
Figure 2.

(A) Polyarginine competition assay; cells were pretreated with 10 μM cisplatin, BBR3464, or TriplatinNC, followed by 1 μM Tamra-R9 after 10 min. White arrows; localization of Tamra-R9 to nucleolar region. Red arrows; nucleolar region (no R9 localization). A representative of three independent experiments is shown. (B) (Top) Experimental scheme for 32P-metabolic rRNA labeling and drug treatment in HCT116 cells. (Bottom) Lanes 1–8 were treated with 0.78, 1.56, 3.13, 6.25, 12.5, 25, 50, and 100 μM TriplatinNC, respectively. Lanes 9 and 10 are untreated control samples. A representative of three independent experiments is shown.
