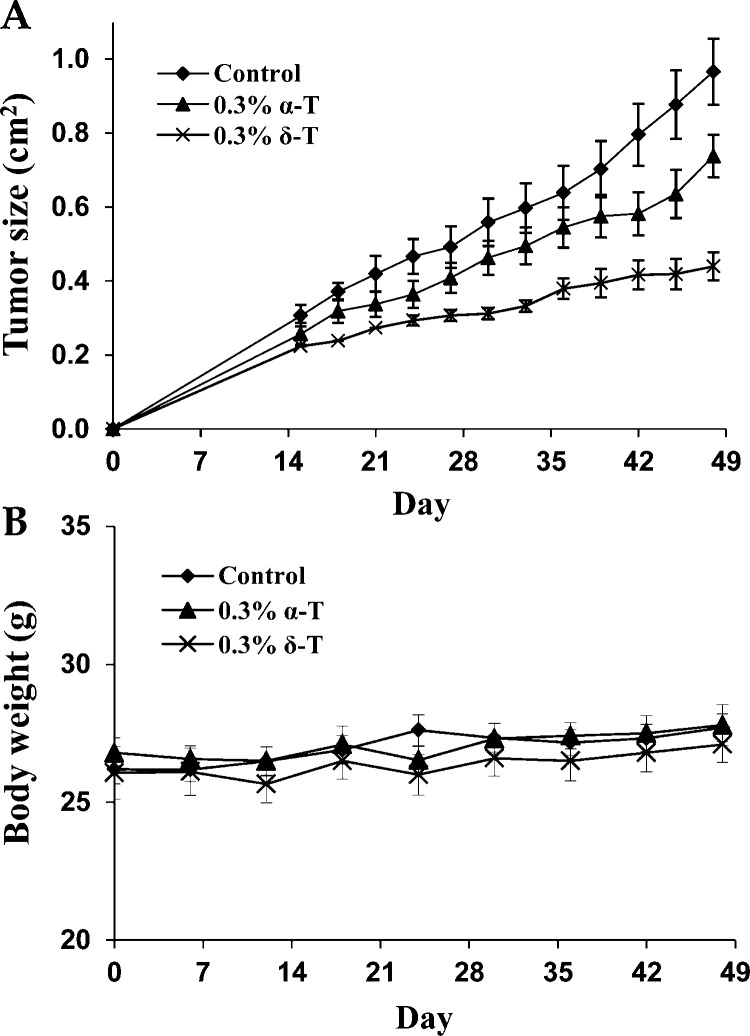
Figure 5.
In vivo effects of α-T and δ-T. Human prostate cancer LNCaP cells were injected subcutaneously into male SCID mice. The mice received AIN93 M diet (10 mice), AIN93 M diet containing 0.3% α-T (10 mice), or AIN93 M diet containing 0.3% δ-T (10 mice) for 48 days. (A) Tumor growth curve (measured as tumor size; cm2) in the control, 0.3% α-T-treated, and 0.3% δ-T-treated groups. (B) Body weight (g) of the mice in each group. Each value represents the mean ± SE.

