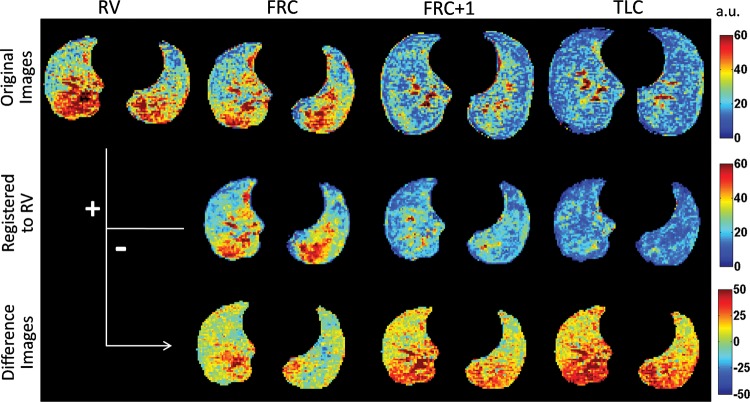
Figure 1:
Representative masked original (top), registered (middle), and proton signal difference (bottom) maps at the top diaphragm level from a healthy volunteer at RV, FRC, FRC+1 L, and TLC. Data are expressed as percentage of the mean heart signal. Color spectra are expressed in arbitrary units (a.u.).

