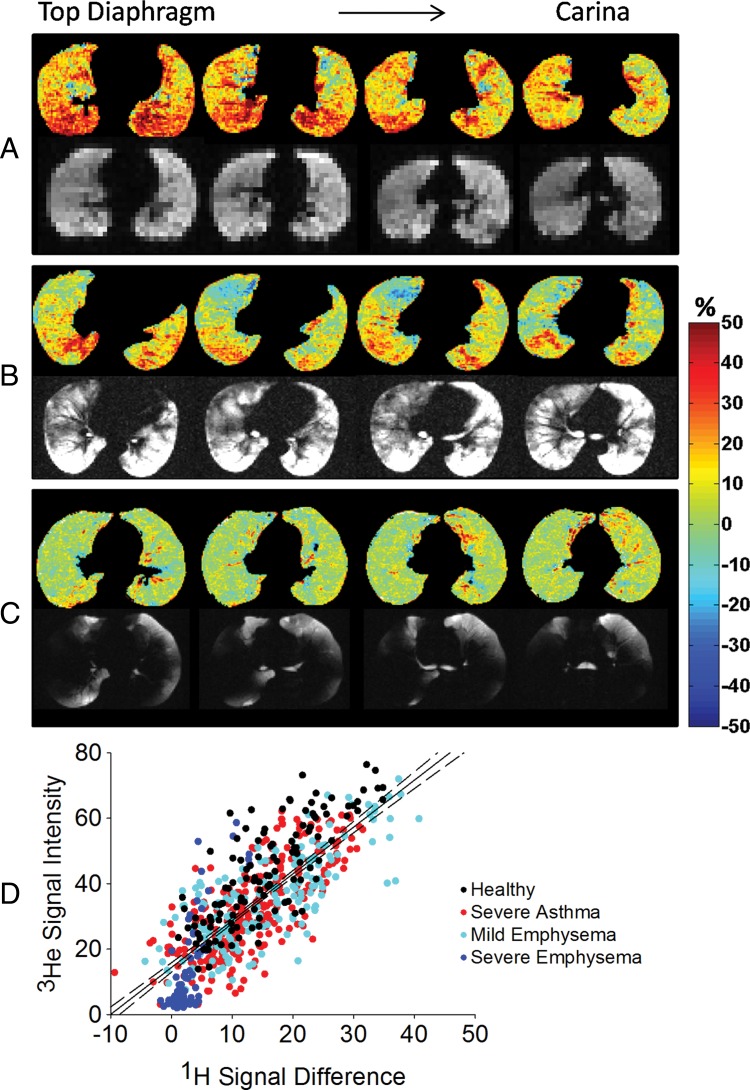
Figure 3:
Corresponding proton density difference maps computed as RV minus TLC and 3He MR images in, A, a representative healthy volunteer, B, a representative patient with asthma (FEV1 = 60% predicted), and, C, a representative patient with severe emphysema (FEV1 = 19% predicted). 1H signal difference is expressed as a percentage of the mean heart signal; 3He signal intensity is expressed as a percentage of the maximum 3He lung value. D, Correlation analysis between 1H signal change and 3He signal intensity in the overall population (R2 = 0.61). Data are expressed respectively in percentage respect to the mean heart signal and to the maximum 3He value within the lung. Dotted lines = 95% confidence intervals for the regressions. Color spectra indicate the 1H signal difference as a percentage of the mean heart signal.

