
Figure 3.
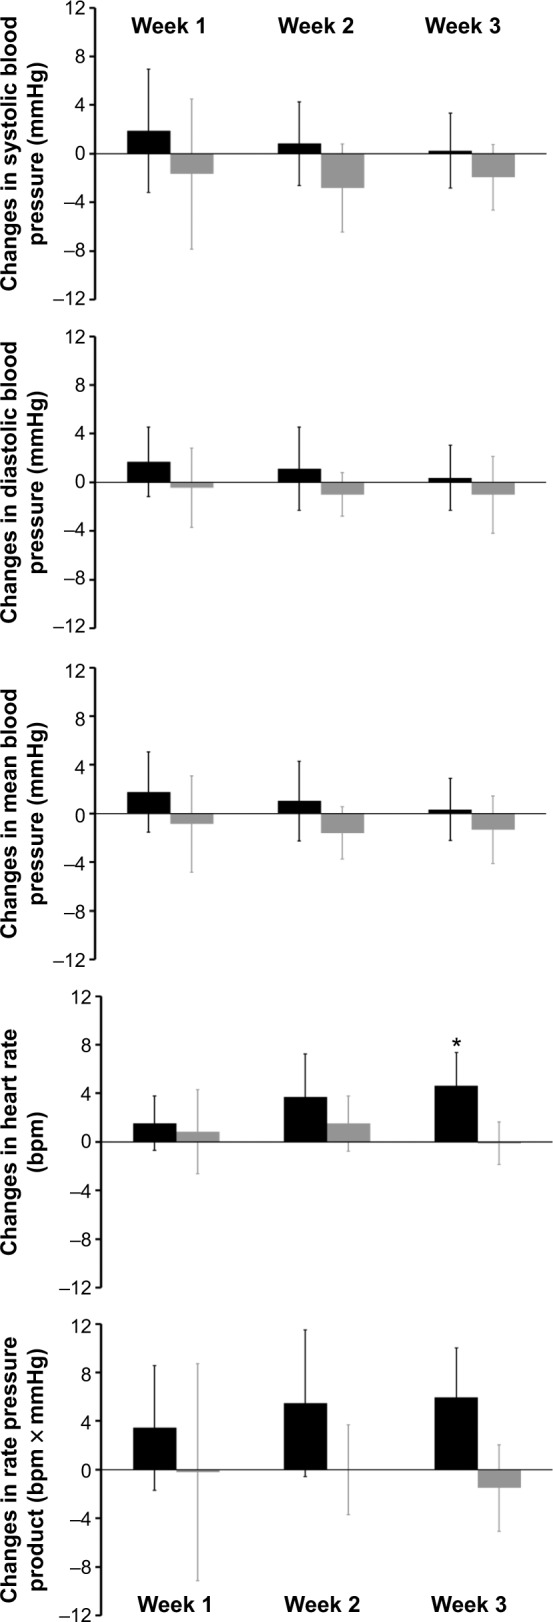
Changes in blood pressure, heart rate and rate pressure product from normoxia to acute hypoxia (hypoxia group; n=8) or sham hypoxia (control group; n=8) during the 3 weeks of the breathing program.
Notes: Data are averages of the five breathing sessions of each week (week 1 to week 3). Values are means ± standard deviation. There was a significant interaction (group and week) for changes in heart rate (two-way ANOVA for repeated measures, P=0.03). *denotes a significant (P<0.05) between-group difference for this week.