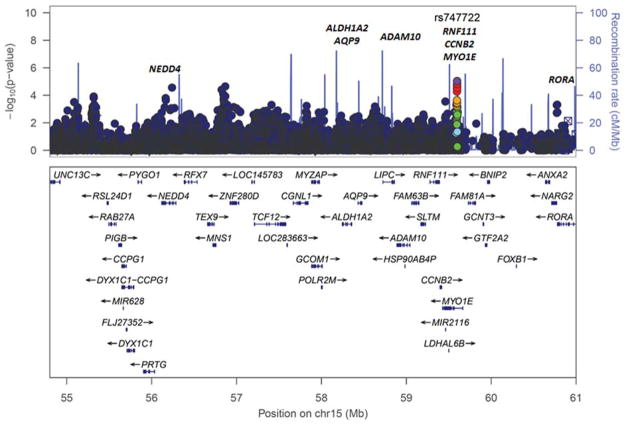
Figure 2. Focused LocusZoom plot of SNP association analyses of genotyped and imputed SNPs within the strongest association interval on chr15q21.2-22.3.
Labeled are candidate genes associated within the regions based on prior studies. We focus on the chr15q21.2-22.3, as it is the region one −log10 down from the − log10 value of the FWER, calculated from n=1000 permutations. The index SNP (SNP with most statistically significant p value) is color coded in purple. The LD between the index SNP and nearby SNPs is indicated by the color coding for the SNP associations, where red indicates high LD (r2 <0.8), orange r2 0.6–0.8, green r2 0.4–0.6, light blue r2 0.2–0.4 and dark blue indicates r2 0.20-0.

