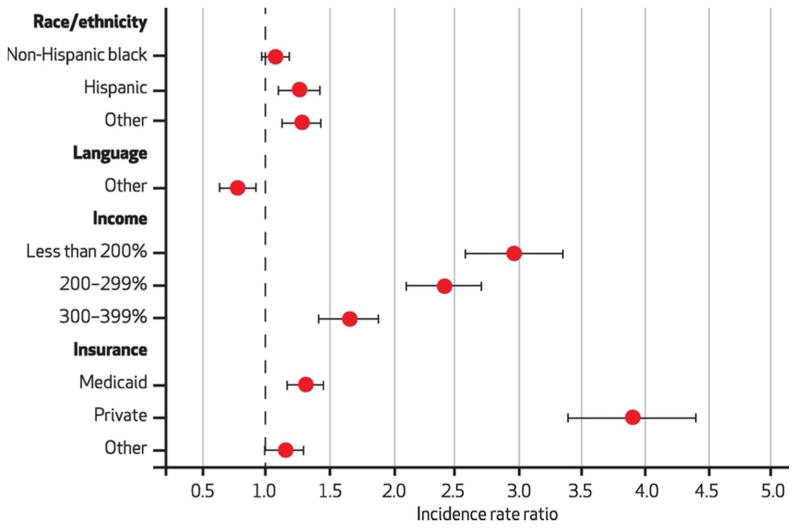
Exhibit 3. Incidence Rate Ratios Comparing The Number Of Unmet Needs, By Determinants Of Health Care Inequity For Children Without Medical Complexity.

SOURCE Authors' analysis of data from the 2005–06 and 2009–10 National Survey of Children with Special Health Care Needs. NOTES The reference groups are the following: for race or ethnicity, non-Hispanic white; for primary language, English; for income (as percentage of the federal poverty level), 400 percent or more; for insurance, private. The whiskers denote 95% confidence intervals. An incidence rate ratio of 1 would indicate the same number of unmet needs that the reference group had. A ratio of greater than 1 indicates more unmet needs than the reference group had, and a ratio of less than 1 indicates fewer unmet needs.
