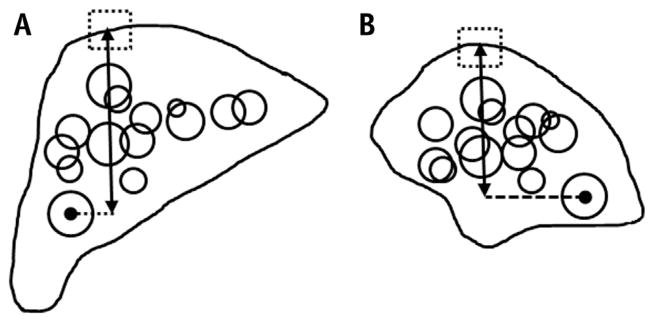
Fig. 1.

Coronal (a) and sagittal (b) views of tumors (circles) from all patients and one sample tracked diaphragm area (dashed squares). The measured distance between tumor and tracked diaphragm area was indicated by the superior–inferior line with the arrows on both ends.
