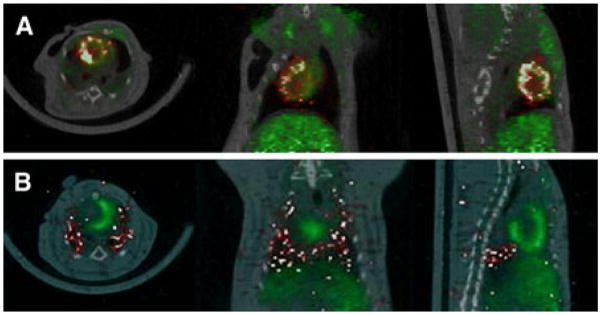
Figure 3.

Quantitative in vivo PET results. A In vivo PET/CT imaging following intracoronary rCDC injection. Yellow arrows indicate 18FDG-labeled rCDCs; myocardium (green) is delineated by 13NH3. B In vivo PET/CT imaging following intravenous rCDC injection. Yellow arrows indicate 18FDG-labeled CDCs; myocardium (green) is delineated by 13NH3.
