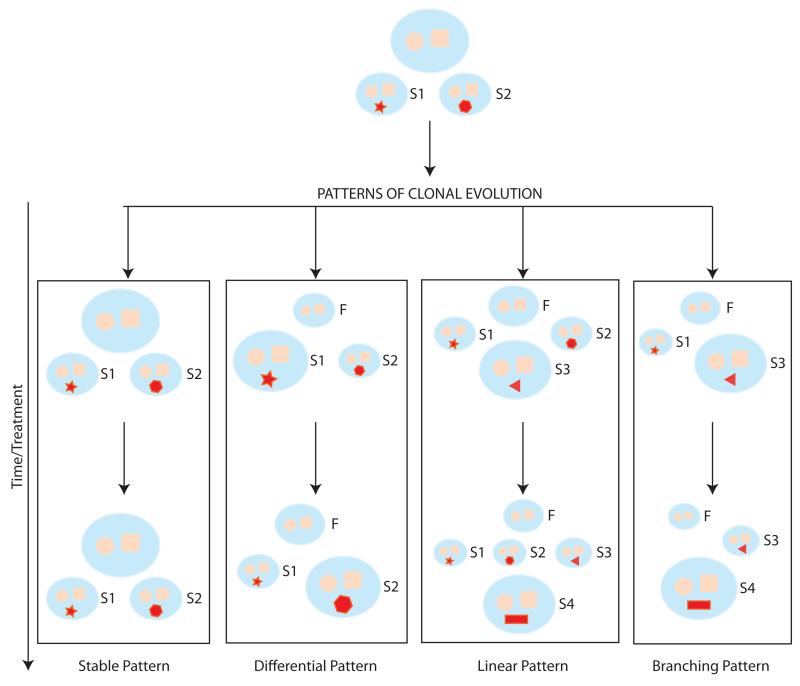
Fig. (1). Patterns of clonal evolution in MM.
The cartoon is a schematic representation of the diverse patterns of clonal evolution as described by Bolli et al. MMCs are represented in pale orange. The blue circle and square represent the mutations of the founding (F) clone, while the various red, geometric shapes reflects acquired, somatic mutations within a subclone (S1, S2, S3 and S4). The size of the clone is representative of the relative dominance within the tumor population, with the largest clone representing the dominant one. Each pattern is represented within a rectangle with the Y axis representing time.
Abbreviations: F: founder clone; S: subclone

