
Figure 1.
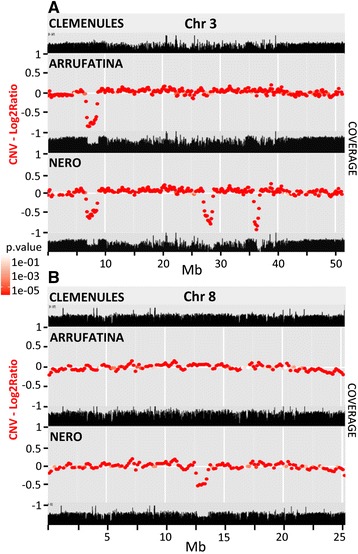
Sequencing coverage and copy number variation (CNV). The sequence coverage and the CNVs along chromosome 3 (A) and chromosome 8 (B) in three clementines, CLE, ARR and NER are shown. Read depths of each chromosome are depicted as black profiles in unitless scales. CNVs are shown as red points at a genome level log2 ratio between CLE, the original variety and either ARR or NER, the two mutations. The red color gradient sections represents log10 p calculated on each of ratios.