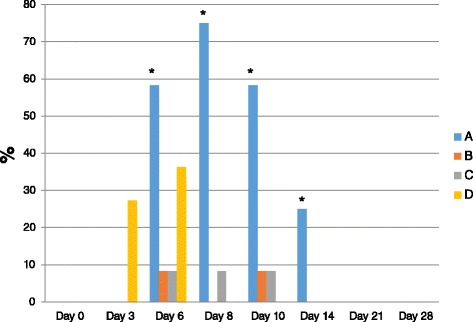
Figure 1.

Total proportion of calves with a positive virus isolation result in WBC and serum samples at each time point after challenge with BVDV 2 1373. The proportion of vaccinated (B, C and D) and control (A) calves with positive virus isolation WBC or serum samples at each time point (day) after challenge with BVDV 2 1373 was higher and more frequent in the control group (A) compared with groups B and C and D. The star *sign refers to statistical significance (P < 0.05).
