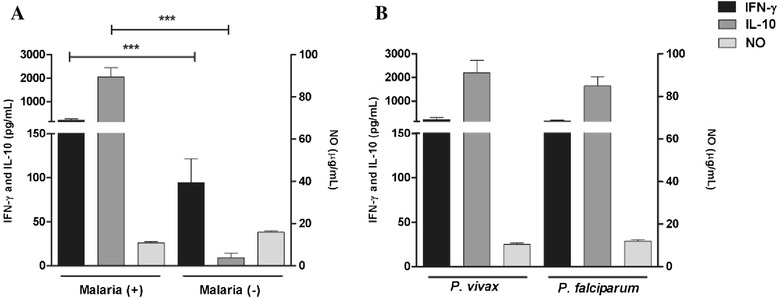
Figure 2.

Levels of IFN-γ (pg/mL), IL-10 (pg/mL) and NO (μg/mL) were compared in Malaria (+) and Malaria (−) groups and according to the plasmodial species. Levels of IFN-γ, IL-10 and NO in: A. Malaria (+) and Malaria (-) groups and B. Plasmodium vivax and Plasmodium falciparum infections. Data are expressed as means levels (means ± SEM) on a logarithmic scale; Statistical significance determined by Mann Whitney U test; ***P value < 0.0001.
