
Figure 1.
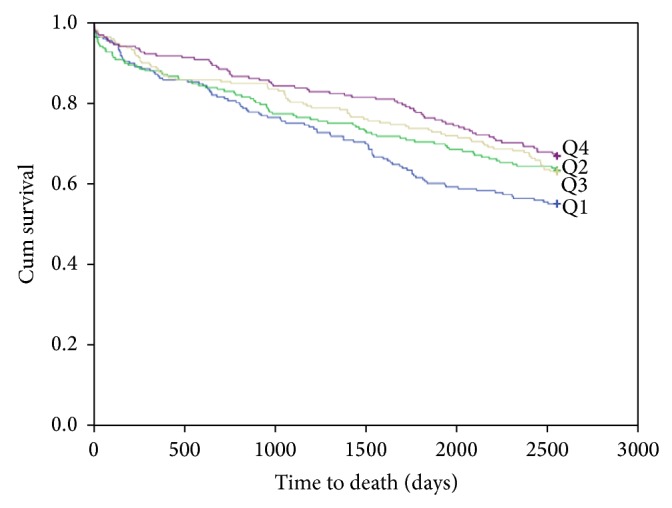
Kaplan-Meier plots for seven-year total mortality of 25(OH)D quartiles in the total patient population.
Official websites use .gov
A
.gov website belongs to an official
government organization in the United States.
Secure .gov websites use HTTPS
A lock (
) or https:// means you've safely
connected to the .gov website. Share sensitive
information only on official, secure websites.
Kaplan-Meier plots for seven-year total mortality of 25(OH)D quartiles in the total patient population.