Fig. 3.
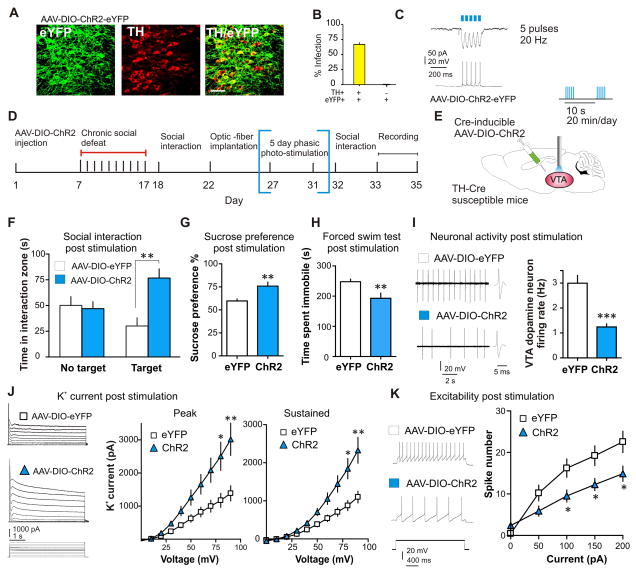
Repeated optogenetic stimulation of VTA DA neurons normalizes the depressed phenotype and induces a significant compensation in K+ currents. (A) Cell type-specific AAV-DIO-ChR2-eYFP expression (green) in VTA DA neurons (red) of TH-Cre mice. Scale bar 100 μm. (B) Quantification shows that ChR2-expressing TH+ cells are 67±4% of total TH+ neurons in the VTA and there was no expression of ChR2 in TH- neurons (n = 2–3 sections per mouse; n = 5 animals). (C) Voltage-clamp (upper trace) and current-clamp (lower trace) recordings from DA neurons in VTA slices. Five short bursts (20 Hz, 40 ms) of blue light (470 nm) induce temporally precise inward photocurrents and corresponding action potentials. (D) Experimental timeline (E) Localization of bilateral viral injection and optic-fiber implantation used for in vivo delivery of blue light in susceptible TH-Cre mice. 470-nm phasic light pulses (20 Hz, five pulses/10 sec) were delivered 20 min a day for 5 consecutive days. (F) After 5 days (20 min/day) of phasic stimulation of DA neurons, susceptible animals expressing ChR2 have increased social interaction (t22 = 3.59, P < 0.01; n = 12), (G) increased sucrose preference (t20 = 3.25, P < 0.01; n = 11), and (H) decreased immobility time during forced swim test (t18 = 2.89, P < 0.01; n = 10). (I) Sample traces and statistic data of VTA DA neuron firing in susceptible mice following chronic excessive activation (t23 = 6.25, P < 0.001; 12–13 cells/6 mice per group). (J) Sample traces and statistic data of K+ currents recorded from VTA DA neurons in brain slices from eYFP and ChR2-expressing neurons. Excessive optical activation of VTA DA neurons significantly increased the peak (at +20 mV: t19 = 3.08, P < 0.01; at +10 mV: t19 = 2.83, P < 0.05; at 0 mV) and sustained (at +20 mV: t19 = 3.53, P < 0.01; +10 mV: t19 = 3.18, P < 0.05) phases of K+ currents. (K) Sample traces at 100 pA current injection and statistic data of decreased excitability in susceptible mice expressing ChR2 compared to eYFP (at 100 pA: t15 = 2.47, P < 0.05; at 150pA: t15 = 2.41, P < 0.05; at 200pA: t15 = 2.32, P < 0.05; n = 8–9 cells/6–8 mice per group). Error bars, ± s.e.m. * P < 0.05, ** P < 0.01, *** P < 0.001.

