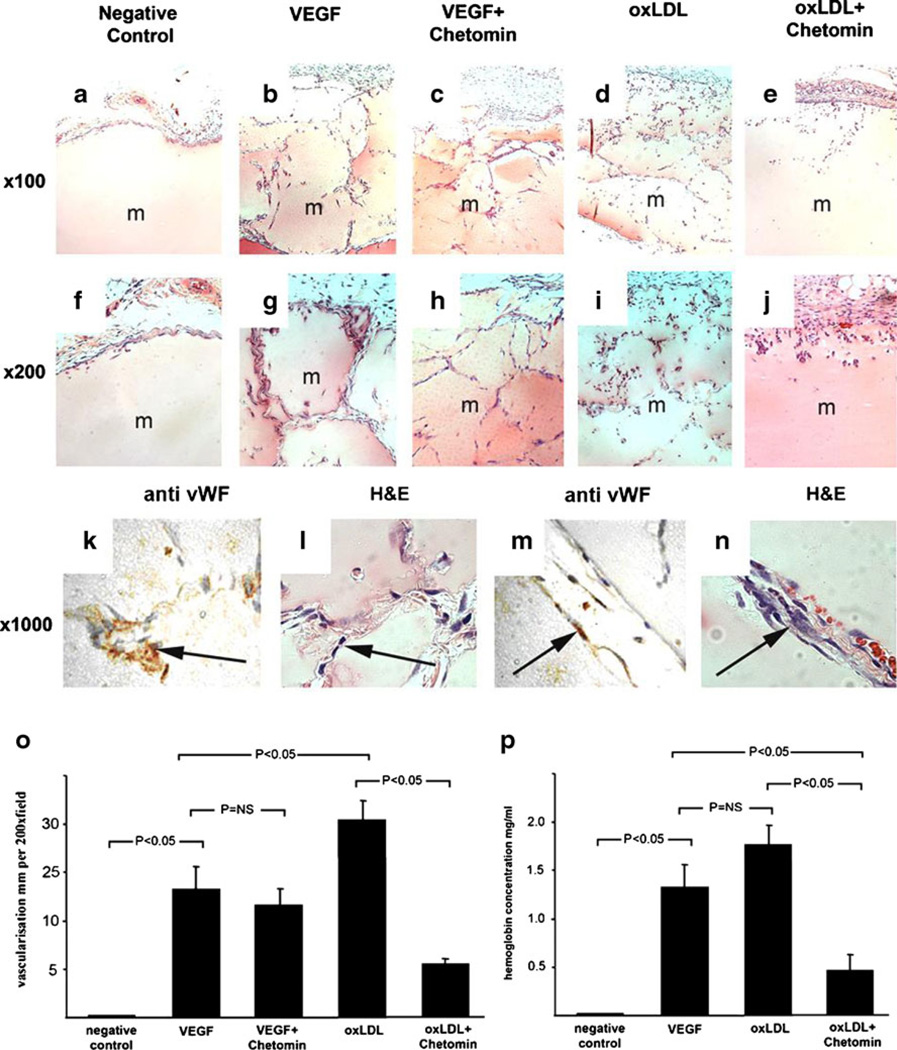
Fig. 2.
Effect of oxLDL on in vivo angiogenesis in Matrigel plug assay, a–j Growth factor-depleted Matrigel was used in an in vivo angiogenesis assay (Matrigel plug assay). Representative pictures for each condition were taken at low (×100) (a–e) and at intermediate (×200) magnification (f–j). As negative control, growth factor-depleted Matrigel was used alone and no capillary networks were observed (a, f). As positive control, growth factor-depleted Matrigel containing 300 ng/ml VEGF was used, and extensive capillary networks were seen (b, g). When combining VEGF treatment with the HIF-1α inhibitor chetomin, the extensive capillary network formation induced by VEGF was unchanged (c, h). Using growth factor-depleted Matrigel containing oxLDL, capillary networks as extensive as those seen with VEGF treatment were noted (d, i). Importantly, when combining oxLDL treatment with the HIF-1α inhibitor chetomin, the increased capillary network formation induced by oxLDL was nearly completely abrogated (e, j). k–n High power magnification (× 1,000) of serial sections of tissue containing oxLDL-treated Matrigel plug stained with anti-CD31 antibody (k, m) reveals that erythrocyte-filled capillary networks seen with H&E staining (l, n) are lined by endothelial cells, o Bar graph comparing the number of capillary networks identified by visual field for each condition. In summary, oxLDL-induced capillary network formation even exceeded that induced by VEGF and, most notably, in contrast to VEGF, was abrogated by treatment with the HIF-1α inhibitor chetomin (ANOVA, P<0.01; error bars ± SEM). p Bar graph comparing Hgb concentration of Matrigel plugs identified by Drabkin’s reagent for each condition. In summary, oxLDL resulted in the highest Hgb concentration and its effect was abrogated by treatment with the HIF-1α inhibitor chetomin (ANOVA, P<0.01; error bars ± SEM)

