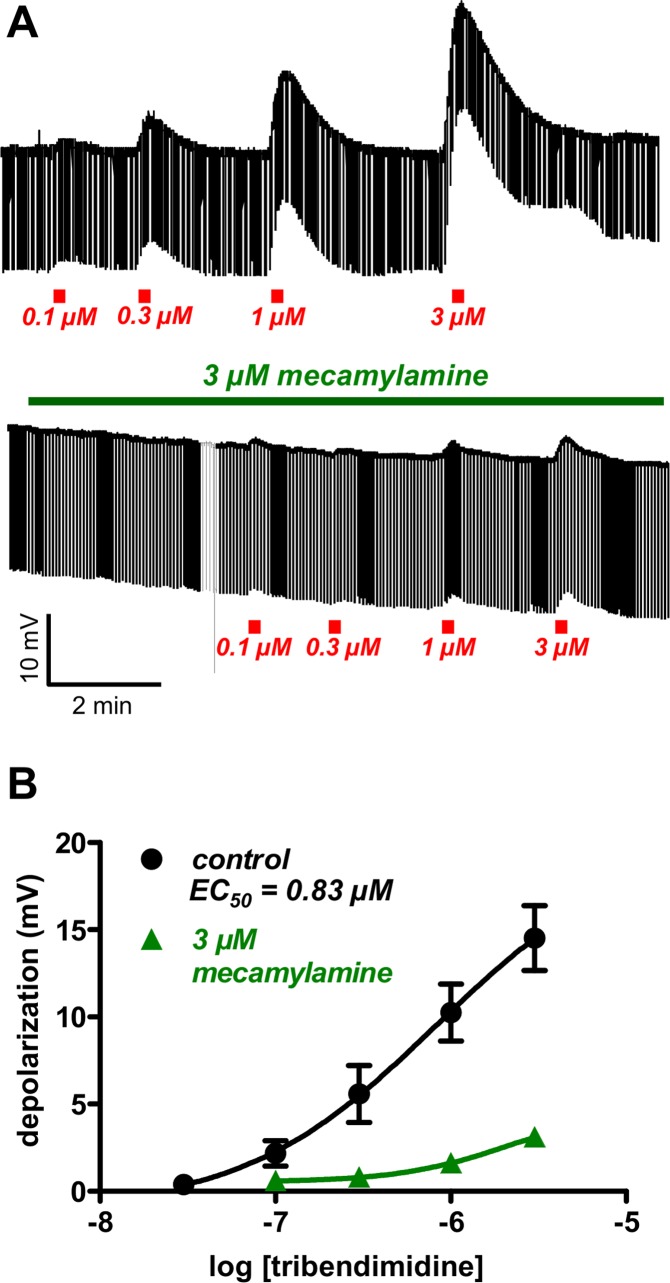
Fig 2. A: Top, representative recording of the application, for 10 seconds, of different concentrations of tribendimidine which produces a depolarization (upward movement of the thickest line) and increase in membrane conductance (decrease in the width of the trace).
Bottom, representative recording of the application for 10 seconds, of tribendimidine in the presence of 3 μM mecamylamine, a nicotinic antagonist, with inhibition of the tribendimidine responses. B: Plots of the mean ± s.e. (n = 4) of the tribendimidine-concentration-depolarization-responses in the absence and presence of 3 μM mecamylamine. The control plot was fitted to the Hill equation allowing estimation of the control EC 50 as 0.83 μM.

