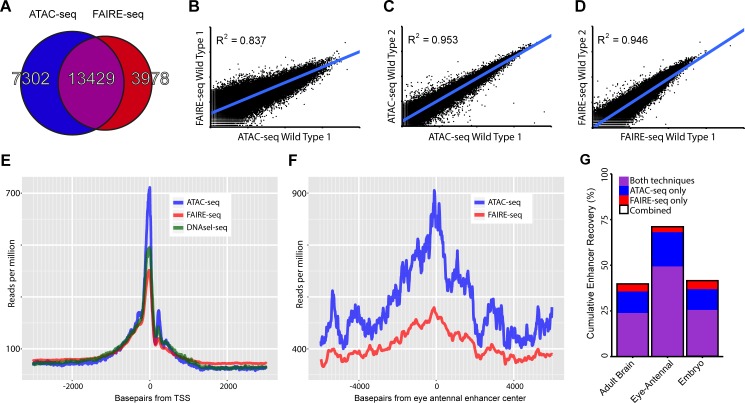
Fig 2. Comparing general features of ATAC-seq and FAIRE-seq.
(A) Venn diagram of peaks called for each technique and the overlap between techniques. (B-D) Correlation plots for replicates of both techniques showing normalized read counts for the entire genome split into regions based on conservation [32]. Both techniques correlate very well within techniques (r2 ∼ 0.95) despite each wild type sample being from different D.melanogaster genetic backgrounds. Correlation between the techniques on the same sample was 0.837; in this case FAIRE-seq seems to reach a limit of signal strength before ATAC-seq does. (E) Aggregation plot showing the aggregated signal for each technique across all transcription start sites (TSS) throughout the genome with a 2.5kb window on either side. Although each technique is enriched exactly at the TSS, there are large differences in the size of this peak, despite being normalized to the total read count within these regions. Note that the background level of FAIRE-seq is higher than that of ATAC-seq and DNaseI-seq which are roughly equal, indicating increased noise level in FAIRE-seq. (F) Aggregation plot showing the aggregated signal for ATAC-seq and FAIRE-seq across all Janelia Farm eye-antennal enhancers with a 5kb window on either side. A more distinct peak can be seen in ATAC-seq which also has a higher level overall, due to the fact that it recovers more enhancers than FAIRE-seq. (G) Sets of enhancers known to be expressed in specific tissues were extracted from the FlyLight database [21], these were then compared with the peaks identified from our ATAC-seq and FAIRE-seq data. The set with the most number of enhancers recovered was the eye-antennal enhancers with a total of 71.01% recovered, whilst 49.31% were recovered by both techniques, an extra 18.75% were identified by ATAC-seq only and 2.95% were identified by FAIRE-seq only.

