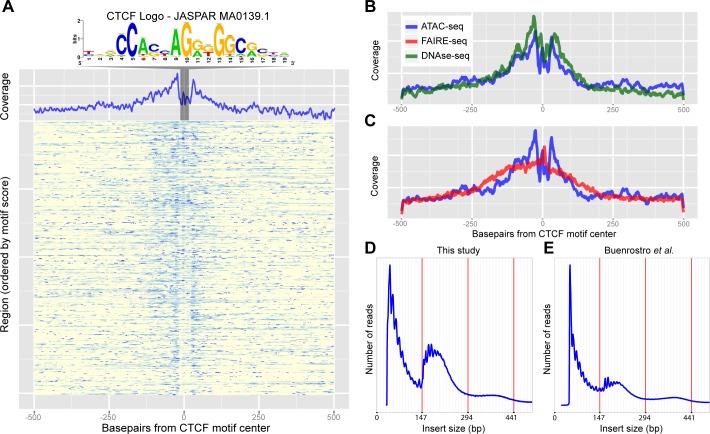
Fig 3. Recovery of known enhancers and CTCF footprinting by ATAC-seq.
(A) Heatmap of ATAC-seq Tn5 transposase cut site occurrence in 500bp around 805 CTCF ChIP peaks centered on the JASPAR-MA0139.1 (CTCF) motif, highlighted and shown above. An aggregation plot shows the overall profile and protection at the motif. (B-C) Comparisons of the DNaseI-seq and FAIRE-seq cut sites respectively with the ATAC-seq profile. DNaseI-seq has a very similar profile whilst FAIRE-seq shows enrichment around the motif but with no protection. (D-E) Histograms showing the frequency of insert sizes from both this study in Drosophila (D) and the study by Buenrostro et al. in humans (E) [24]. Red lines indicate the amount of DNA bound by one, two and three nucleosomes.

