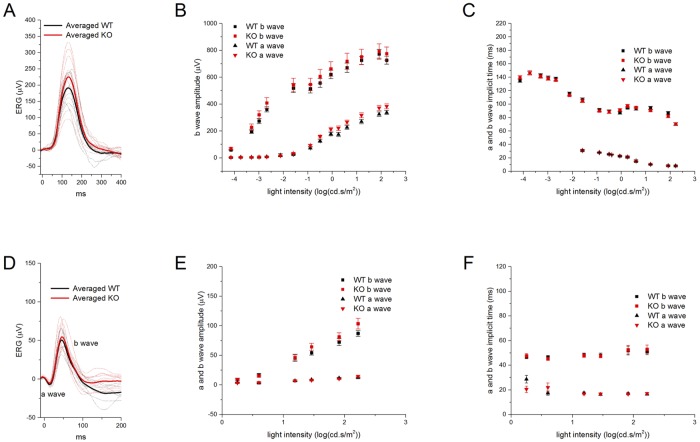
Fig 4. Comparison of the ERGs of TRPM3-/- and TRPM3+/+ mice.
A) Traces of low pass-filtered scotopic ERGs from TRPM3+/+ (black) and TRPM3-/- (red) mice. The flash intensity was-3.3 log(cd-s/m2). Each dashed line is the averaged response from one eye. The thick lines are averages for each genotype. The amplitude (B) and implicit time (C) of the scotopic a- (▲) and b- (■) waves at different light intensities are plotted for TRPM3+/+ (black) and TRPM3-/- (red) mice. Data points show the mean with the standard error of the mean. D) Traces of low pass-filtered photopic ERGs from TRPM3+/+ (black) and TRPM3-/- (red) mice. The flash intensity was 1.91 log (cd-s/m2) under 100 cd/m2 white light background. Each dashed line is the averaged response from one eye. The thick lines are averages for each genotype. The amplitude (E) and implicit time (F) of the photopic a- (▲) and b- (■) waves at different light intensities are plotted for TRPM3+/+ (black) and TRPM3-/- (red) mice. Data points show the mean with the standard error of the mean.

