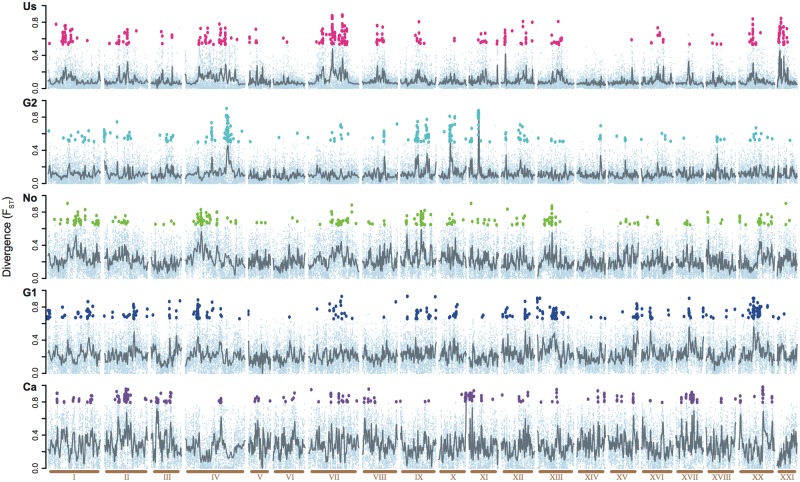
Figure 2. Comparison of the divergence across the genome in five parapatric lake-river pairs.
Panels are ordered by increasing overall divergence (Us, G2, No, G1, Ca). Divergence (FST) was averaged over 10 kb windows (small, light blue dots). Windows with exceptional differentiation (1,530 outlier windows) are highlighted with a population-specific color. Grey lines indicate smoothened averages across windows. All 20 autosomes excluding the sex chromosome (LG XIX) are shown along the x-axis in ascending order (light brown). We only find a weak correlation of FST values across the autosomes between the two geographically closest population pairs (G1 and G2, 34958 windows, Pearson correlation r = 0.0595, P << 0.001).

