
Figure 3. ERC disease gene prioritization.
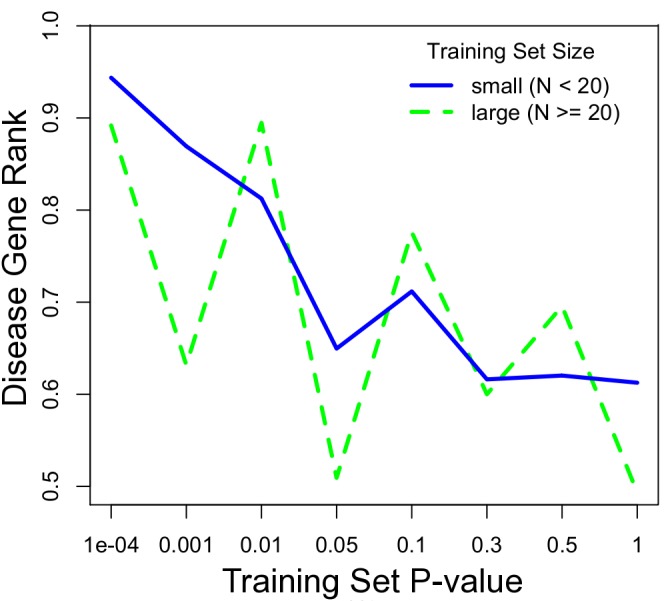
The prioritization of the true disease gene relative to its chromosomal neighbors improves with a stronger ERC signal within the training set. A low p-value (x-axis) indicates strong ERC within a training set. Prioritization (y-axis) is presented as the proportion of candidate genes scoring lower than the true disease gene, i.e. higher represents better prioritization. The blue series is for diseases with training sets with 20 or fewer genes, representing the majority (70%) of OMIM diseases interrogated. The dotted green line is for those diseases with larger training sets.