
Figure 4.
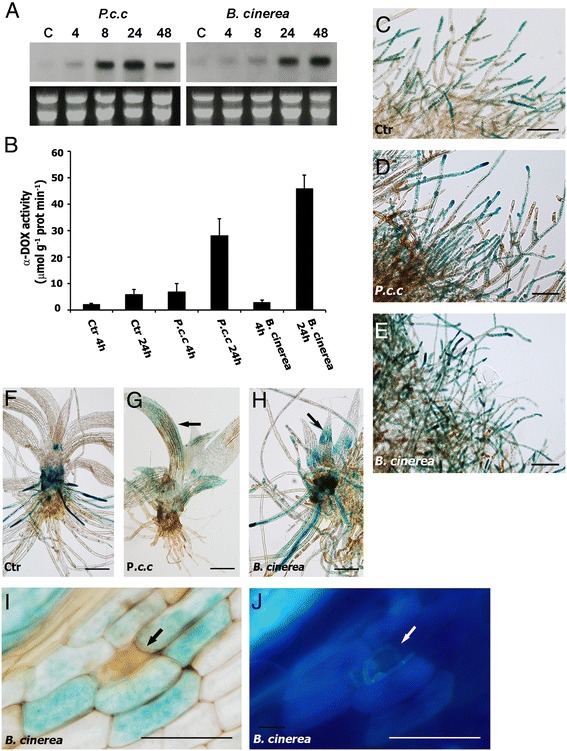
Ppα-DOX expression and Ppα-DOX activity in response to Pectobacterium elicitors and spores of B. cinerea . (A) Expression of Ppα-DOX in response to elicitors of P.c. carotovorum (P.c.c) and spores of B. cinerea at different hours after treatments. (B) Ppα-DOX activity in tissues treated with water (Ctr), elicitors of P.c. carotovorum (P.c.c), and spores of B. cinerea at 4 and 24 hours. GUS accumulation in protonemal tissues of Ppα-DOX-GUS-2 line treated for 24 hours with water (C), elicitors of P.c. carotovorum (D), and spores of B. cinerea (E). GUS accumulation in gametophores of Ppα-DOX-GUS-2 treated for 24 hours with water (F), elicitors of P.c. carotovorum (G), and spores of B. cinerea (H). GUS accumulation in leaves treated with elicitors of P.c. carotovorum or spores of B. cinerea are indicated with an arrow. (I) GUS accumulation in a B. cinerea-infected leaf showing Ppα-DOX expression in cells surrounding a cell, which is infected with B. cinerea as evidenced by hyphae staining with the fluorescent dye solophenyl flavine 7GFE 500 (J). Scale bars: 100 μm in C-E; 300 μm in F-H; 20 μm in I-J. A brown infected cell in I, and hyphae in J are indicated with a black and white arrow respectively.