Figure 5.

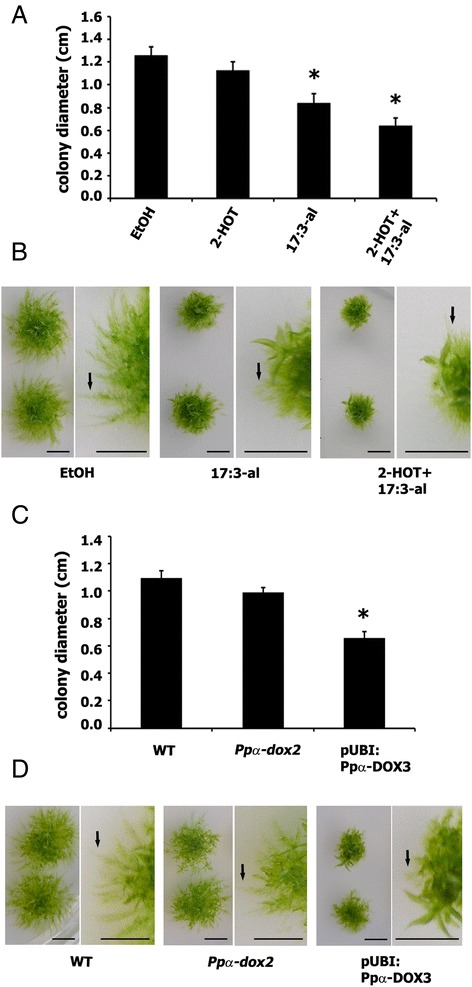
Effect of α-DOX-derived oxylipins on moss colony morphology. (A) Size of single moss colonies grown for 21 days in 50 μM of 2-HOT, 50 μM of 17:3-al or 50 μM 2-HOT+ 50 μM 17:3-al containing BCDAT medium, measured as diameter in centimeters, relative to control moss colonies grown on 0.5% ethanol. (B) Representative individual colonies and closer views showing the typical phenotype after 21 days of growth on 50 μM 17:3-al or 50 μM 2-HOT+ 50 μM 17:3-al-containing medium in comparison with control plants grown on 0.5% ethanol. (C) Size of wild-type (WT), Ppα-dox-2 and pUBI:Ppα-DOX-3 moss colonies grown for 21 days in BCDAT medium measured as diameter in centimeters. (D) Representative individual colonies and closer views of WT, Ppα-dox-2 and pUBI: Ppα-DOX3 showing the typical phenotype after 21 days of growth. Arrows in B and D indicate protonemal filaments. Results and standard deviation correspond to 16 colonies per sample. Asterisks for colonies grown on 50 μM of 17:3-al or 50 μM 2-HOT+ 50 μM 17:3-al, or pUBI:Ppα-DOX-3 colonies, indicate that the values are significantly different from control plants, or WT plants, respectively, according to Kruskal–Wallis test: P <0.001. Arrows indicate representative protruding caulonemal filaments. Scale bars represent 0,5 cm.
