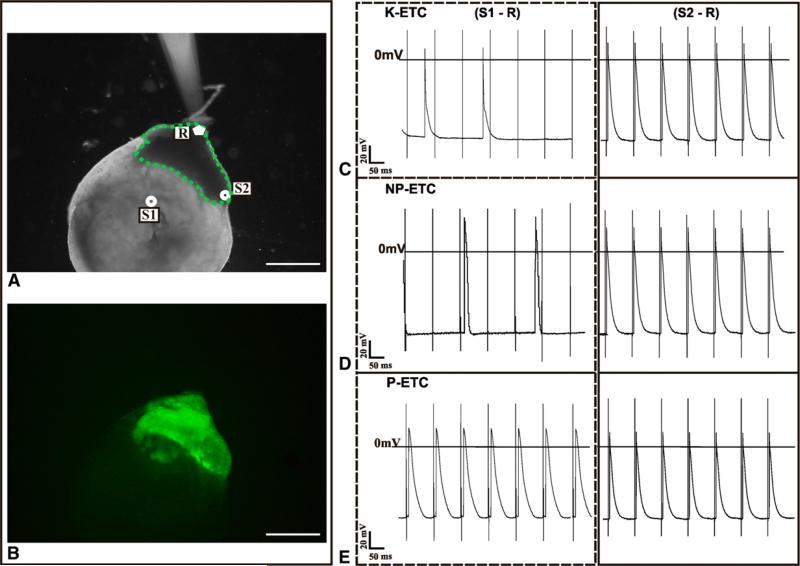
FIGURE 3.
Electrophysiologic measurements of EHSs co-cultured with ETCs. A, Positions of electrodes for electrophysiologic measurements: stimulation in the ETC (S1), stimulation in the EHS (S2), and recording in the EHS (R). B, eGFP-positive embryonic ventricle slice (EHS) in co-culture with ETC. C-E, Representative APs measured at R from stimulation at S1 (ETC) and S2 (EHS) for killed engineered tissue construct (K-ETC; C), nonpreconditioned tissue construct (NP-ETC; D), and preconditioned engineered tissue construct (P-ETC; E). Traces on the left show AP at R from stimulation at S1 (ETC to EHS), and traces on the right show AP at R from stimulation at S2 (EHS to EHS). Scale bars = 1 μm.

