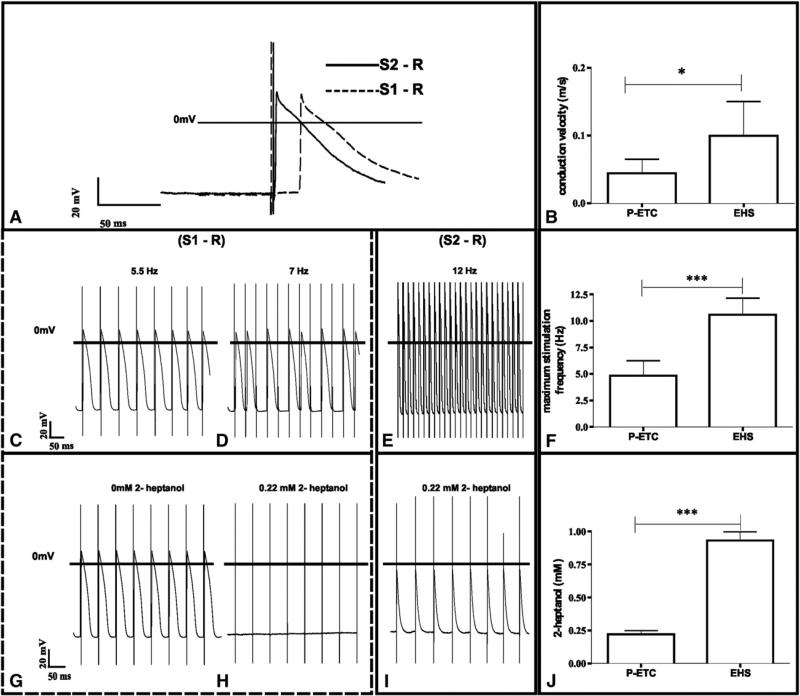
FIGURE 4.
Characterization of electrophysiologic coupling between preconditioned engineered tissue constructs (P-ETC) and embryonic heart slice (EHS). A and B, Conduction velocity: overlay of exemplary EHS APs (A) evoked by unipolar stimulation in the ETC (S1) and EHS (S2). Significant differences in conduction velocity measurements (B) between P-ETC to EHS and EHS to EHS. C-F, Maximum stimulation frequency: P-ETC stimulation and EHS measurement show APs at 5.5 Hz stimulation (C), but resulting in conduction blocks at 7 Hz (D), whereas EHS stimulation follows EHS recording until 12 Hz without conduction blocks (E), resulting in different maximum stimulation frequency between P-ETC to EHS and EHS to EHS measurements (F). G-J, 1-Heptanol sensitivity: AP at EHS from 5.5 Hz stimulation at P-ETC before 1-heptanol treatment (G) and after addition of 0.2 mmol/L 1-heptanol (H). Stimulation at EHS still results in AP at EHS at 0.2 mmol/L 1-heptanol (I) and 1-heptanol blocking concentration (J) between P-ETC to EHS and EHS to EHS measurements. *P<.05. ***P<.001, n = 5.

