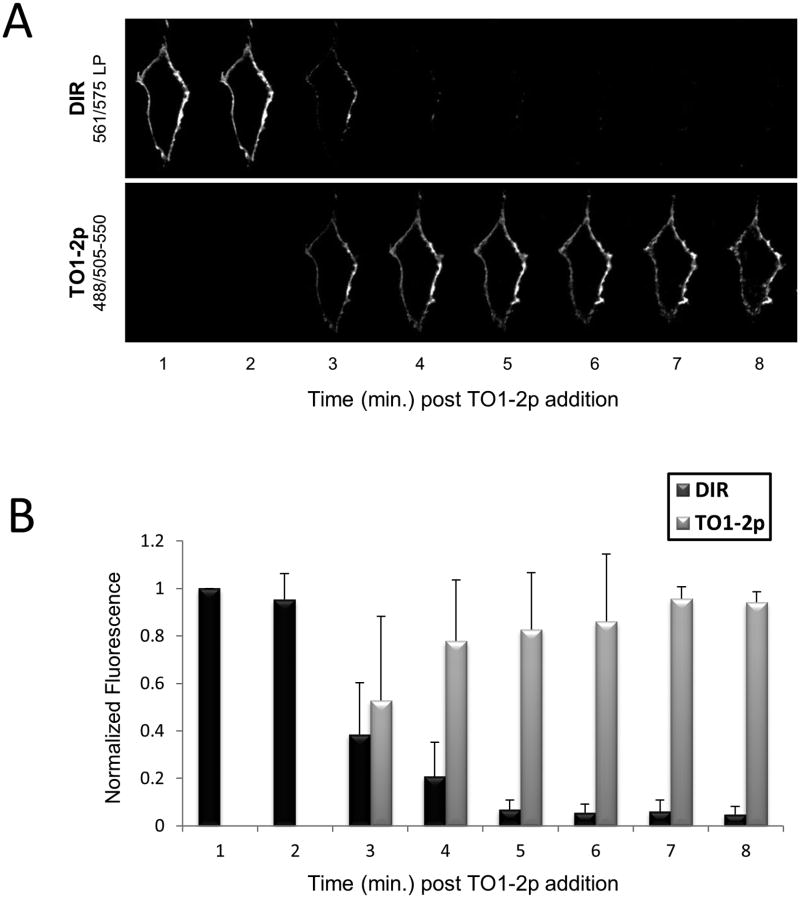
Figure 7.
Multi-spectral detection and dynamic color switching from a FAP-ZZ reagent. A: Micrographs of live HA-tagged HEK 293 cells labeled with primary antibody and (TO-FAP)-ZZ reagent at the surface. Cells were initially placed in 200 nM DIR fluorogen medium; after addition of 1 uM TO1-2p fluorogen, time series image acquisition followed. B: Graph of normalized mean fluorescence intensities from captured images at every 1 min interval (n=5 images).

