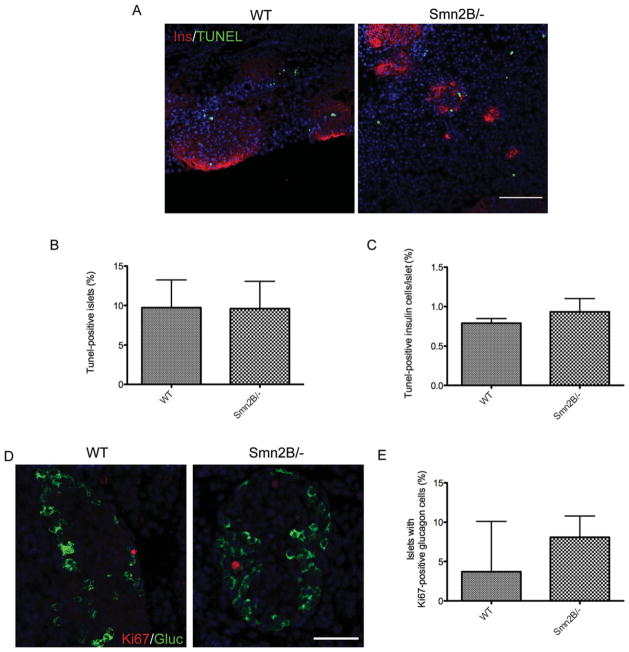
FIGURE 4.
Smn2B/− islets do not show increased β cell apoptosis or α cell proliferation. (A) Representative images of P10 pancreatic islets of wild-type (WT) and Smn2B/− mice colabeled for insulin (Ins; red; β cells), TUNEL (green), and Hoechst (blue; nuclei). Scale bar = 100μm. (B, C) Quantification of the percentage of TUNEL-positive islets (B) and the percentage of tunnelpositive insulin cells per islet (C) shows no difference between WT (n = 3) and Smn2B/− (n = 3) mice. Data are mean ± standard deviation (SD). (D) Representative images of P10 pancreatic islets of WT and Smn2B/− mice colabeled with Ki67 (red), glucagon (Gluc; green; α cells), and Hoechst (blue; nuclei). Scale bar = 50μm. (E) Quantification of the percentage of islets with Ki67-positive/ glucagon-positive cells shows no difference between WT (n = 3) and Smn2B/− (n = 3) mice. Data are mean ± SD.

