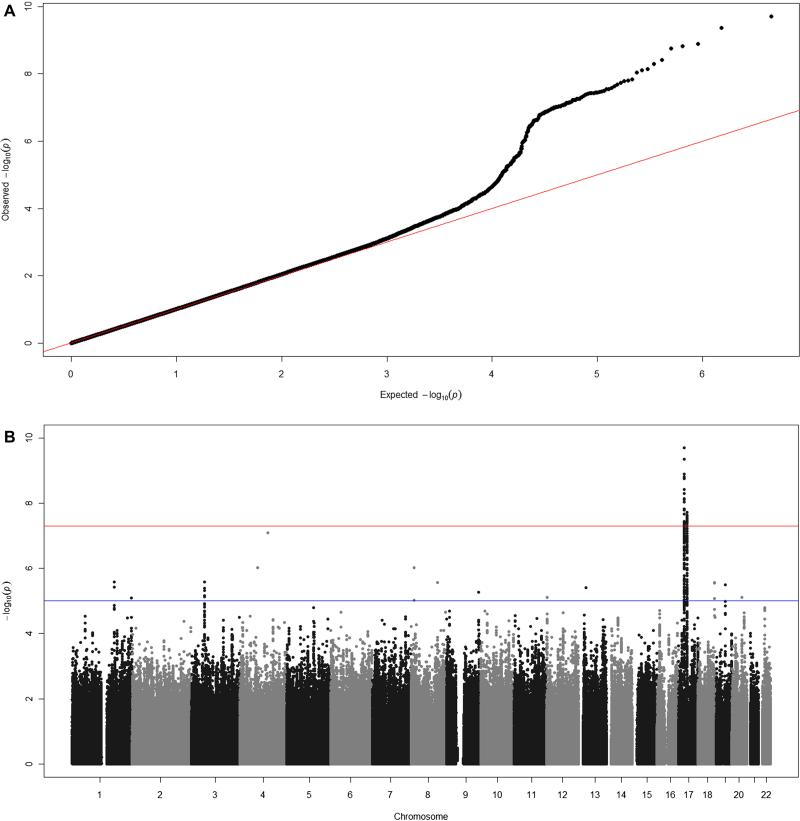
Figure II. QQ and Manhattan plots of 2,253,077 SNPs of 14 GWA studies (N = 8,858).
QQ plot of 2,253,077 SNPs of 14 GWA studies. The black dots represent observed P values and the red line represents the expected P values under the null distribution. Manhattan plot showing the association P values of FeNO of the 14 studies. The –log10 of the P value for each of 2,253,077 SNPs (y-axis) is plotted against the genomic position (x-axis).

