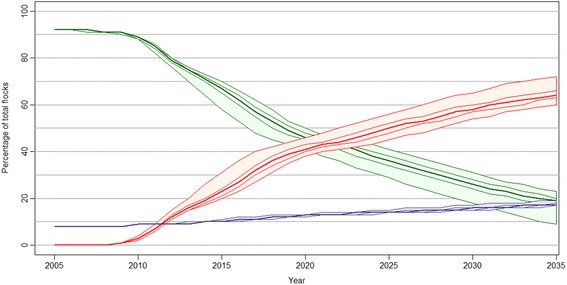
Figure 2.

Simulated development of severe footrot in Norwegian sheep flocks without an elimination programme. The percentage of susceptible (green), infected (red) and low susceptible (purple) flocks are shown for each of the years 2005 – 2035 with the median value and 2.5, 25, 75 and 97.5 percentiles.
