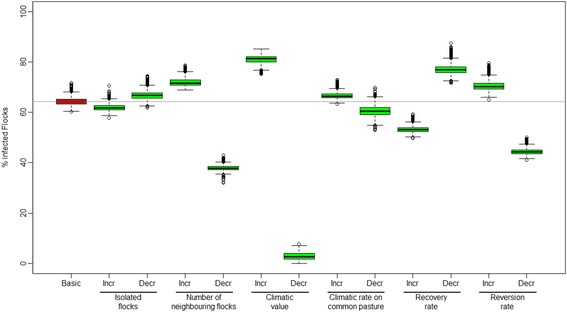
Figure 6.

Sensitivity analysis of parameters used in a model for the spread of severe footrot. The box-and-whiskers plot shows the distribution of the estimated percentage of flocks infected with severe footrot in Norway in 2035 based on 2000 replicates. The basic scenario is shown in red and the 80% increase and decrease in the variables in the model is shown in green. The box represents the 25 and 75 percentiles and the black line inside the box represents the median value. Circles outside the whiskers are outliers. BasicS = Basic scenario, Incr = 80% increase in the variable and Decr = 80% decrease in the variable.
