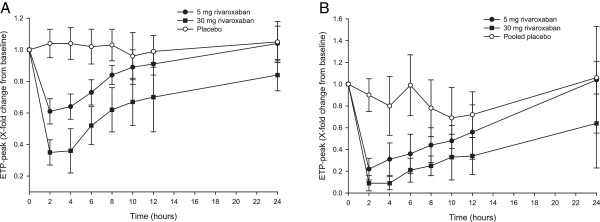
Figure 1.

Effect of rivaroxaban 5 mg and 30 mg, and placebo, on thrombin generation. (A) ETP peak after activation by collagen (5 μg/ml), (B) ETP peak after activation by tissue factor (1.4 nmol). Data are mean relative change from baseline ± standard deviation. The difference between treatments was assessed in this study using the area under the time–effect profile curve; both rivaroxaban doses were significantly different from placebo, but not significantly different from each other. Reproduced with permission from Graff J et al.[28]. ETP, endogenous thrombin potential.
