
Figure 2.
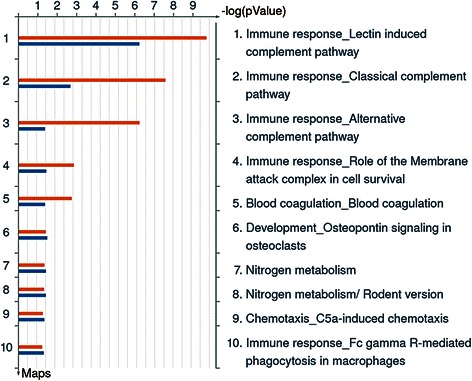
MetaCore “Enrichment analysis” on proteins with altered plasma levels (FC ≥ 1.5 or ≤ −1.5). The histograms represent the most significant biological process maps in which the proteins are involved. The results are ranked by the -log(p-value). Red histograms, Phase 1 Exploratory study; blue histograms, Phase 2 EPIC study.