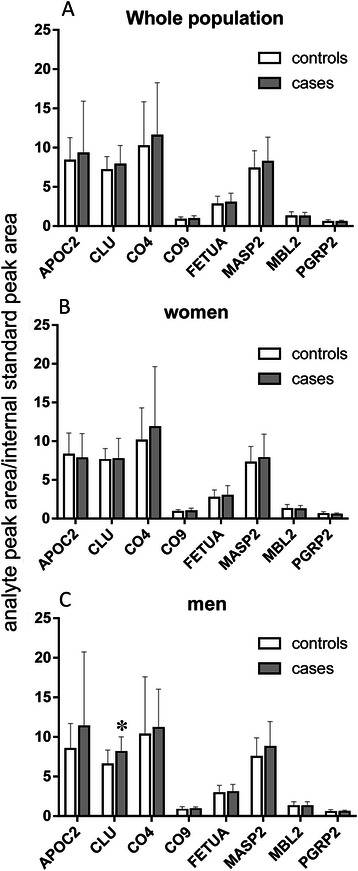
Figure 3.

Bar chart showing the relative amounts of proteins analysed by targeted proteomics (LC-SRM-MS) in the whole EPIC population (Panel A), in women only (Panel B) and in men only (Panel C). Bars and error bars refer to mean ± SD of the ratio of the analyte peak area to that of the internal standard. The asterisk indicates a significant difference between EPIC CRC male cases and controls (P = 0.0167 Mann–Whitney U, two-tailed).
